
Bitcoin is trading around $57,500 after a volatile session sparked by the release of the CPI data. Amid the market turbulence, CryptoQuant’s on-chain and macro researcher Axel Adler shared an interesting observation about Bitcoin and mining stocks.
According to Adler, a strong correlation exists between the Bitcoin price and the public miners’ stock index, as highlighted in a CryptoQuant chart. This suggests that any movements in Bitcoin price could directly affect the value of mining stocks.
As investors maintain high expectations for Bitcoin’s performance in the coming months, the price of BTC will likely play a crucial role in determining the fate of both mining companies and BTC-related stocks. With market sentiment fluctuating, the relationship between Bitcoin and mining stocks remains a key factor for investors to monitor.
Bitcoin Miners Waiting For A Bounce
After weeks of extreme fear, volatility, and uncertainty, Bitcoin (BTC) is regaining momentum, and investors are increasingly optimistic about future gains. This renewed confidence is especially strong among Bitcoin miners, particularly those tied to public miner stocks, whose performance is closely linked to Bitcoin price movements.
A detailed report from CryptoQuant’s on-chain and macro analyst, Axel Adler, highlights how mining company stocks’ growth heavily depends on Bitcoin price action. This relationship became especially noticeable during the bull run of 2021-2022 when both BTC and miner stocks soared in tandem.
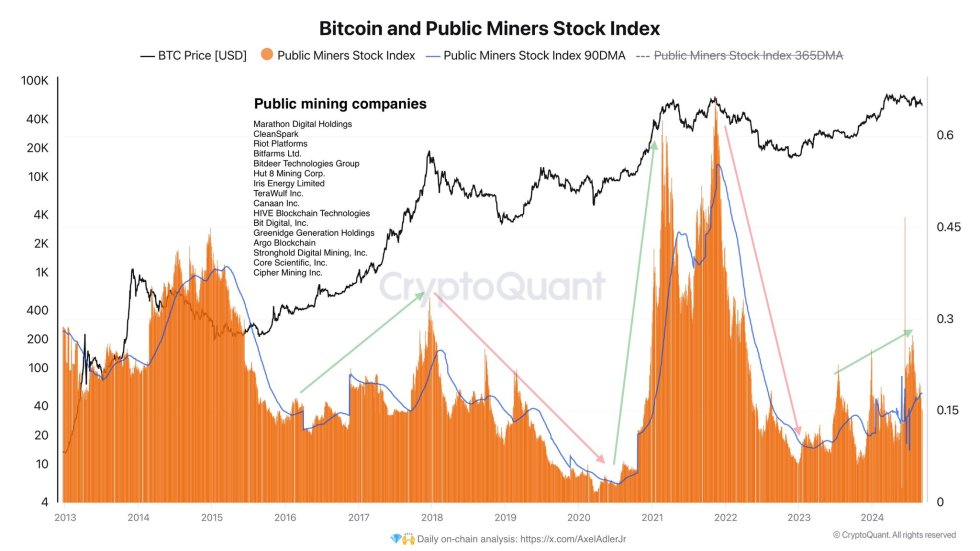
While this correlation has generated renewed interest in miner stocks, it also raises concerns for analysts. Bitcoin price has not yet confirmed a clear uptrend or recovery since the market’s downturn in March, which leaves miners in a cautious position.
Miners have reacted by gradually reducing their BTC holdings, a sign of caution amid potential price concerns. On-chain data shows that miner balances have steadily declined since the beginning of September.
Glassnode data reveals a gradual decrease in Bitcoin held by miners since September 2, with the total miner balance currently standing at around 1.8 million BTC, valued at approximately $99 billion at current prices.
If this selling pressure from miners continues, it could significantly impact Bitcoin price in the short term, as increased supply from miners selling their coins tends to put downward pressure on prices.
On the other hand, other market factors, such as positive regulatory news or increased institutional adoption, could provide a bullish catalyst for Bitcoin, lifting both BTC and miner stocks. Ultimately, how these factors play out will determine whether Bitcoin and related equities can sustain the current momentum or face further challenges ahead.
Bitcoin Price Action Details
Bitcoin (BTC) is currently trading at $58,219 after experiencing a volatile day yesterday. The price has surged over 10% since September 6 and is now testing a crucial resistance level.
If this resistance is broken, it could signal further price appreciation. BTC is just 1.26% away from the 4-hour 200 exponential moving average (EMA) at $58,758, a key technical indicator that has acted as resistance since early August.
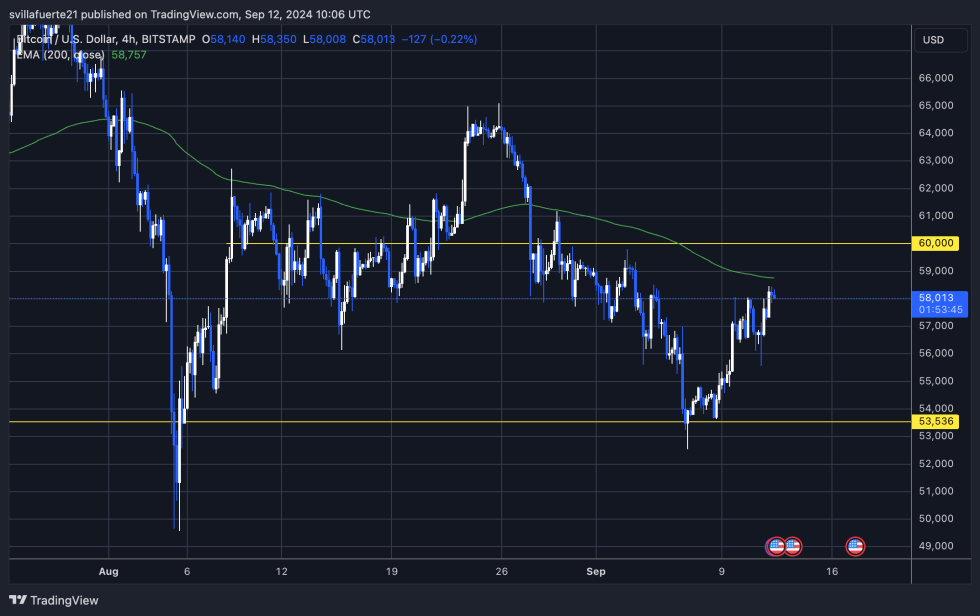
A short-term trend change would likely occur if BTC breaks this resistance and successfully tests it as support. For bulls to gain strong momentum, the price must surpass $60,000, a significant psychological level seen as a turning point by many investors.
However, if BTC fails to close above these critical levels in the coming weeks, a deeper correction could follow, with the potential for lower prices as the next logical scenario in the current market environment.
Featured image from Dall-E, chart from TradingView