
On-chain data shows the Bitcoin Active Addresses metric has plunged to very low levels recently. Here’s what this could mean for the asset’s price.
Bitcoin 30-Day MA Active Addresses Now Down To Just 1 Million
As explained by CryptoQuant author Axel Adler Jr in a new post on X, the BTC Active Addresses indicator has been on the decline recently. This metric measures, as its name already suggests, the total number of addresses participating in some kind of transaction activity on the Bitcoin blockchain every day.
The unique number of active addresses may be considered the same as the unique number of users interacting with the network, so this indicator’s value can tell us about the amount of traffic that BTC is dealing with right now.
When the metric’s value rises, it means the number of users using the network is going up. Such a trend implies that the blockchain is currently attracting attention. On the other hand, the indicator registering a decline suggests that investor interest in the cryptocurrency may be decreasing as fewer users are making transactions.
Now, here is a chart that shows the trend in the 30-day and 365-day moving averages (MAs) of the Bitcoin Active Addresses over the last few years:
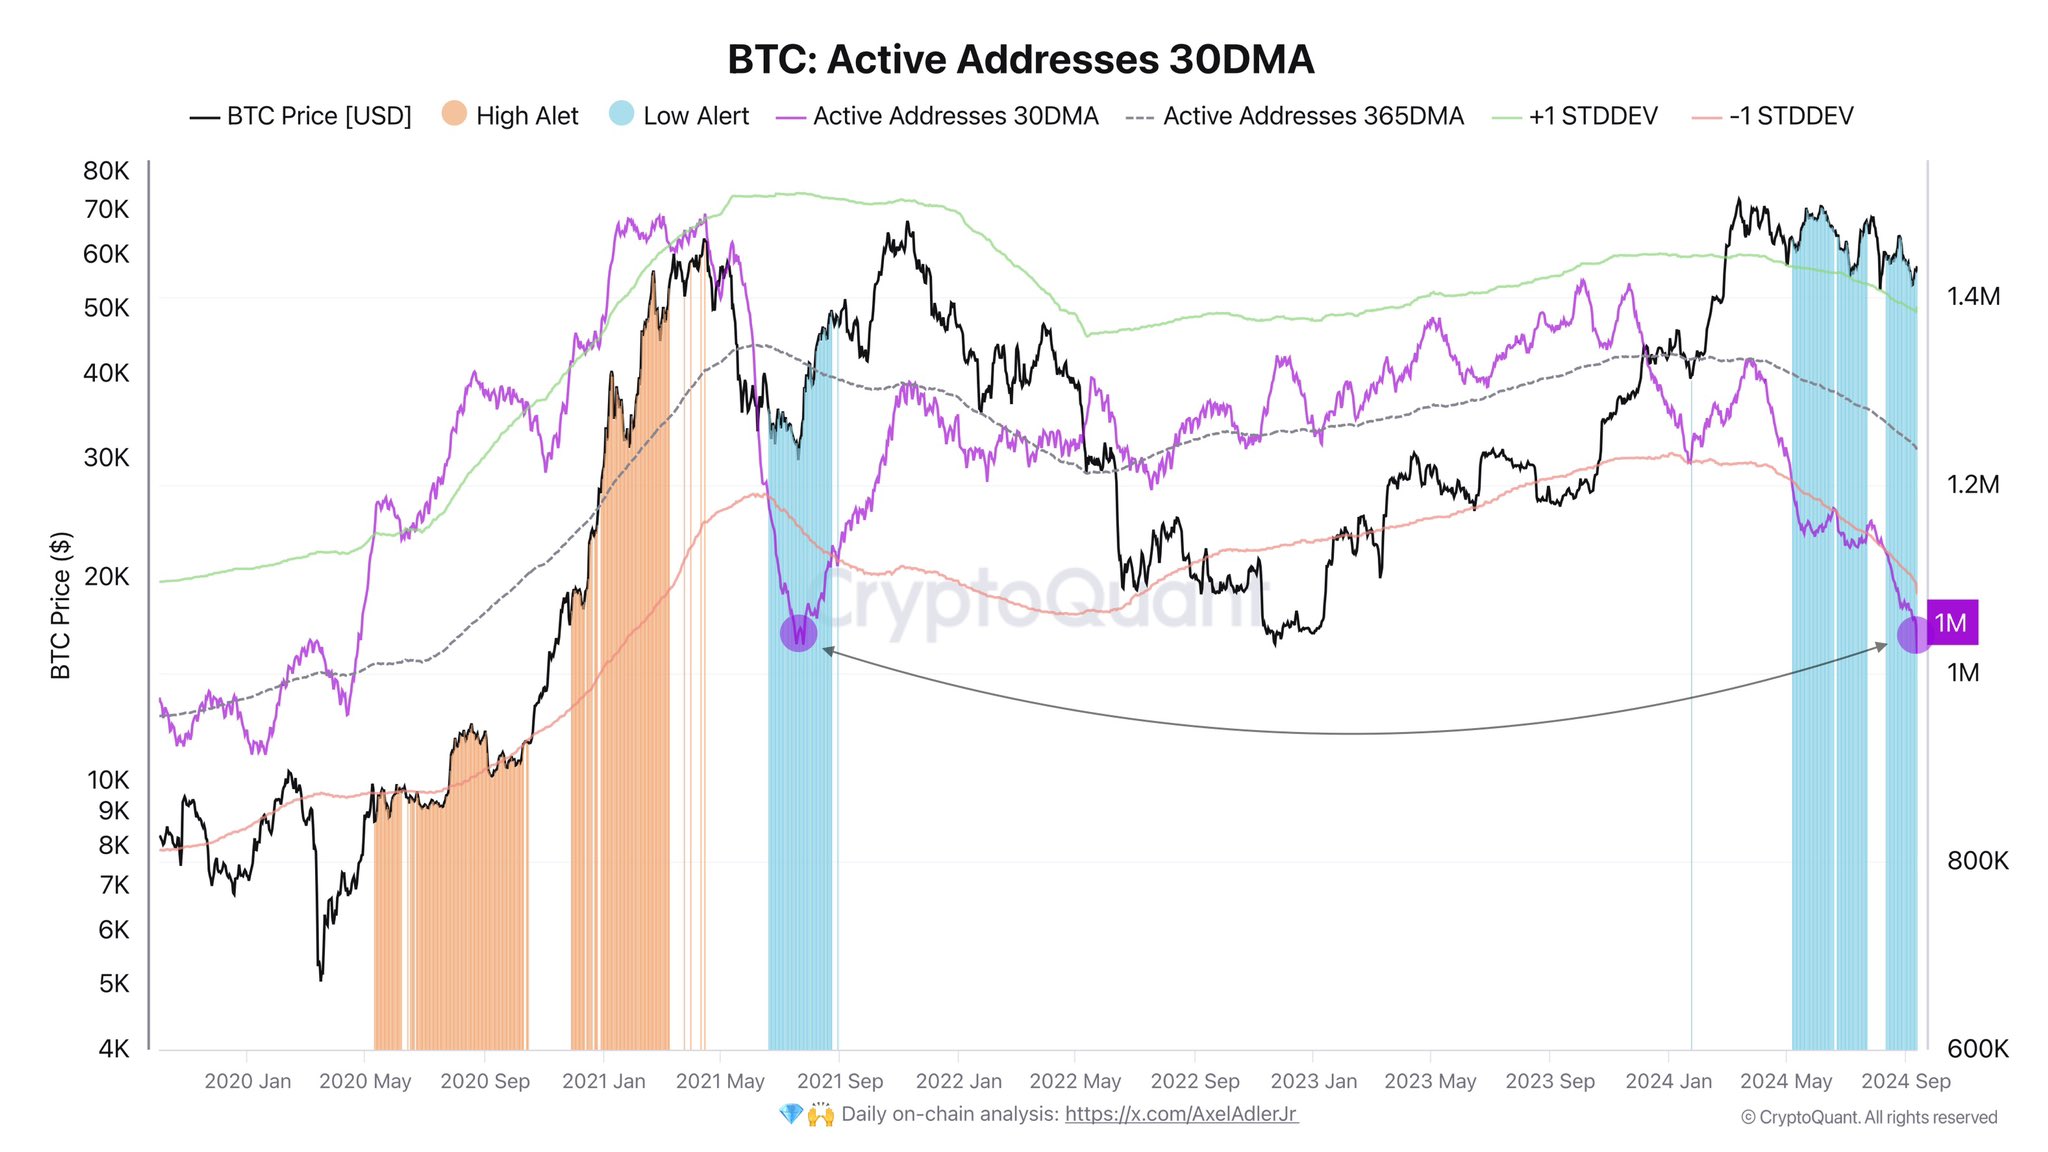
The value of the metric appears to have been on the decline in recent months | Source: @AxelAdlerJr on X
As is visible in the above graph, the 30-day MA of the Bitcoin Active Addresses has been declining for the past year. The indicator had temporarily deviated from this downtrend during the price rally towards the all-time high (ATH), but had resumed business as the asset had slumped to consolidation.
Investors find sharp price action like rallies exciting, so it’s not surprising that the surge earlier in the year quickly attracted a lot of attention. The boring price action that has followed since then, however, has made users lose interest just as fast.
Soon after the 30-day MA Active Addresses had resumed its downwards trajectory, its value had seen a plunge under the 365-day MA, and since then, the two lines have maintained this arrangement.
This would suggest that the recent monthly activity of Bitcoin has been lower than the average for the past year. In fact, at its current value of around 1 million, the 30-day MA of the Active Addresses is at a level similar to the one witnessed back in July 2021.
The July 2021 slump came as China banned BTC mining, which adversely affected the cryptocurrency’s price. Nonetheless, the Active Addresses didn’t stay at these lows for too long, as the network came back alive, and the bull run saw a second wave.
Historically, any sustainable move in the asset has required a rise in the Active Addresses, as the new users coming in provide the fuel needed to keep such runs going. As such, until the Active Addresses can rebound, Bitcoin may not be able to see another lasting rally now as well.
BTC Price
Bitcoin had recovered back above $58,000 earlier in the day, but it would appear the asset has slipped off again as its price is now trading at $57,700.
Looks like the price of the coin has been going up over the last few days | Source: BTCUSDT on TradingView
Featured image from Dall-E, CryptoQuant.com, chart from TradingView.com