highdog
NVDA Remains The Undisputed King Of Semiconductor Stocks, With A Relatively Cheap PEG Ratio
We previously covered Nvidia Corporation (NASDAQ:NVDA) in June 2024, discussing its robust FQ1 ’25 results and promising FQ2 ’25 guidance, with it pointing to a durable long-term generative AI demand, significantly aided by the announcement of long awaited 10-for-1 stock split.
Even so, with the market overly exuberant and the semiconductor company likely to report tougher YoY comparisons ahead, we then believed that it might be more prudent to wait for a moderate retracement before adding.
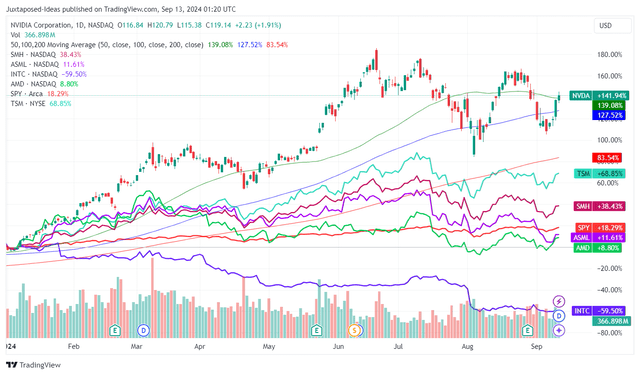
NVDA YTD Stock Price
Since then, NVDA has retraced by -25.6% at its worst before recovering drastically upon the CEO’s optimistic outlook in the recent Goldman Sachs Communacopia + Technology Conference. It pointed to the durability of generative AI boom across infrastructure, SaaS, cloud service providers, and developers.
The same has also been highlighted by Taiwan Semiconductor aka TSMC (TSM), with the foundry reporting robust August 2024 revenue growth of +33% YoY and YTD growth of +30.8% YoY, attributed to the “strong structural AI related demand.”
This is significantly aided by NVDA’s double beat FQ2 ’24 earnings results, with revenues of $30.04B (+15.3% QoQ/ +122.5% YoY), richer gross margins of 75.7% (-3.2 points QoQ/ +4.5 YoY), and adj EPS of $0.68 (+11.4% QoQ/ +151.8% YoY) — well exceeding the original top-line guidance of $28B.
It goes without saying that the tailwinds are attributed to the data center revenues of $26.3B (+16% QoQ/ +154% YoY), thanks to the insatiable demand for the H200 tensor core despite the Blackwell issues.
We maintain our belief that the delayed rollout remains a minimal headwind, attributed to NVDA’s robust FQ3 ’24 revenue guidance of $32.5B (+8.1% QoQ/ +79.3% YoY) and non-GAAP gross margins of 75% (-0.7 points QoQ/ inline YoY).
These developments continue to signal the insatiable chip demand, especially when compared to FY2024 margins of 73.8% (+14.6 points YoY) and FY2020 margins of 62.5% (+0.8 points YoY).
The Consensus Forward Estimates
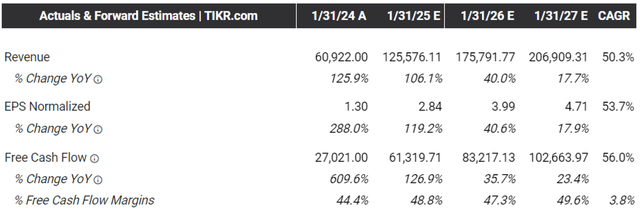
Despite the tougher YoY comparison, it is unsurprising that the consensus have raised their forward estimates, with the semiconductor company expected to generate an accelerated top/ bottom-line growth at a CAGR of +50.3%/ +53.7% through FY2026.
This is compared to the previous estimates at +38%/ +40.7% and the historical growth at +25.5%/ +27.8% between FY2017 and FY2023, respectively.
NVDA Valuations
As a result of these developments, we believe that NVDA is not expensive at FWD P/E non-GAAP valuations of 41.16x, down from the 5Y mean of 47.24x though higher than the sector median of 23.11x.
This is because of the relatively low PEG non-GAAP ratio of 1.13x, compared to its 5Y mean of 2.08x and the sector median of 1.82x, with it implying its accelerated bottom-line growth prospects.
Even if we compare against its semiconductor peers, such as Advanced Micro Devices (AMD) at 1.07x, Intel (INTC) at 1.90x, Broadcom (AVGO) at 1.69x, it is undeniable that NVDA remains cheaply valued as a high-growth stock at current levels. It offers interested investors an improved margin of safety.
Risk Warning
One, the ongoing US election campaigns have thrown some uncertainties in the future of the US semiconductor industry, especially attributed to the numerous trade/ export restrictions to the Middle East and China — with the latter comprising 12.1% of NVDA’s FQ2 ’25 revenues (+2.6 points QoQ/ -8.1 YoY).
Depending on the results of the election by November 2024, we may see more volatility surrounding the industry, worsened by the rumors of INTC’s potential divestiture of certain business units.
Two, NVDA’s financial performance is inherently linked to four key customers, likely the top three hyperscalers, Amazon’s AWS (AMZN), Google Cloud (GOOG), and Microsoft (MSFT), along with Meta (META) — with these already comprising 46% of its FQ2 ’25 revenues.
While these companies have placed hefty orders for Blackwell, with the production ramp to commence from FQ4 ’24 onwards and the NVDA management expecting “to ship several billion dollars” in the quarter alone, readers must note that these hyperscalers have also been “creating as much as possible their own compute silicon,” according to AVGO.
With AVGO’s Custom Application-Specific Integrated Circuits [ASIC] business already growing by 3.5x YoY by the latest quarter, we may see the hyperscalers’ AI accelerator weightage mix eventually tip towards custom silicon, attributed to the “compelling price performance” ratio as reported by AMZN.
As a result, while NVDA has been the clear and undisputed king of AI accelerators thus far, it remains to be seen if the same trend may persist over the coming years. This is especially true given the relatively heavy top-line weightage commanded by these hyperscalers.
Investors may want to continue monitoring its top-line and gross margins in the intermediate term, since these factors are highly indicative of the semiconductor company’s pricing power in a highly competitive market.
Even so, we believe that NVDA may remain the top choice for many large enterprises, attributed to the high barrier to entry for the exorbitant custom silicon chips. The 50% in direct sales exposure to consumers, IoT, and enterprise companies should well balance any potential sales cliff from the hyperscalers.
Lastly, the semiconductor company’s sales growth across gaming, professional visualization, automotive, and OEM industries remain robust at +8.3% QoQ/ +18.5% YoY in the latest quarter, allowing it to report the well diversified growth prospects upon the normalization in data center sales.
So, Is NVDA Stock A Buy, Sell, or Hold?
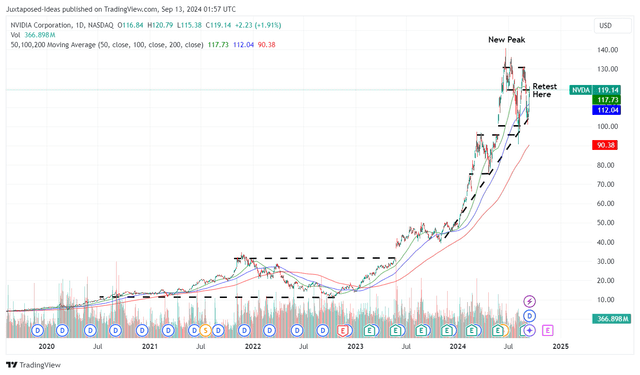
NVDA 5Y Stock Price
For now, the head and shoulder pattern that we warned investors about has turned out as expected. NVDA lost much of its Q2 ’24 gains and failed to its break out of its $130s resistance levels while being well-supported near its 100-day moving averages.
For context, we had offered a fair value estimate of $49.40 in our last article, based on the FY2024 adj EPS of $1.29 and the previous 1Y P/E mean valuations of 38.15x.
Based on the LTM adj EPS of $2.21 ending FQ2.25 and the same 1Y P/E mean, we are looking at an updated fair value estimate of $84.30, with it not too far from the recent August 2024 bottom of $95s.
Based on the consensus raised FY2026 adj EPS estimates from $4.13 to $4.71, there remains an excellent upside potential of +50.7% to our raised long-term price target from $157.50 to $179.60 as well.
As a result of the rather attractive risk/ reward ratio, we are reiterating our Buy rating for the NVDA stock. However, we add the caveat that investors observe the price movement for a little longer before adding according to their dollar cost average and risk appetite, preferably at the established support level of $100s for an improved margin of safety.
Editor’s Note: This article discusses one or more securities that do not trade on a major U.S. exchange. Please be aware of the risks associated with these stocks.


