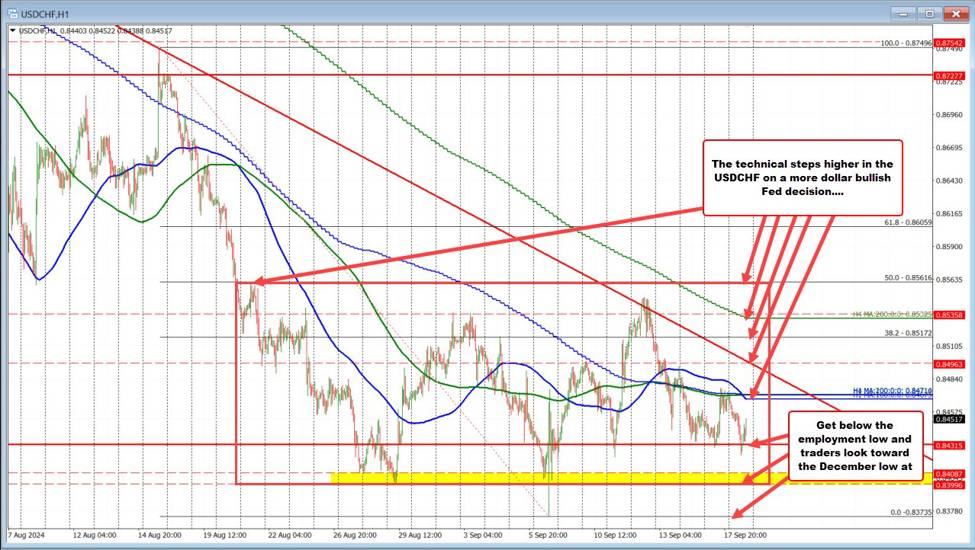
In this video, I take a look at the technical roadmap for traders through the FOMC rate decision. What would increase the bearish bias and why? What would shift the bias more to the bullish side – at least in the short term.
With the price lower and trading near 2024 lows, and the price below the 100/200 hour MAs and the 100 bar MA on the 4-hour chart, the bias is more bearish. However, if the price were to move above those MAs between 0.8467 to 0.8471, the bias – at least in the short term- would shift higher with other targets on the topside.
Targets on the topside on a more hawkish move:
- Get above cluster or MA at 0.84718
- Downward trend line near 0.8496.
- 38.2% of the move down from the August high at 0.8517.
- 200 bar MA on the 4-hour chart (not broken since mid-July 0.8532
- 50% and swing high from AUgust 21 at 0.8561
Targets on the downside on a more dovish move:
- Get and stay below 0.8431
- Swing area between 0.8399 to 0.84087
- Low after US jobs report at 0.83735.
Move below that level and the end of December 2023 low at 0.83318 and the USDCHF is trading at the lowest level going back to 2011. That is a long time ago….

