Fundamental
Overview
Last Friday, the PBoC
announced new easing measures which included further rate cuts and stock buyback
funding. Moreover, we got
some positive economic
data with Retail Sales
and Industrial Production beating expectations by a big margin. These catalysts
provided support for copper which erased most of last week’s losses.
Copper
Technical Analysis – Daily Timeframe
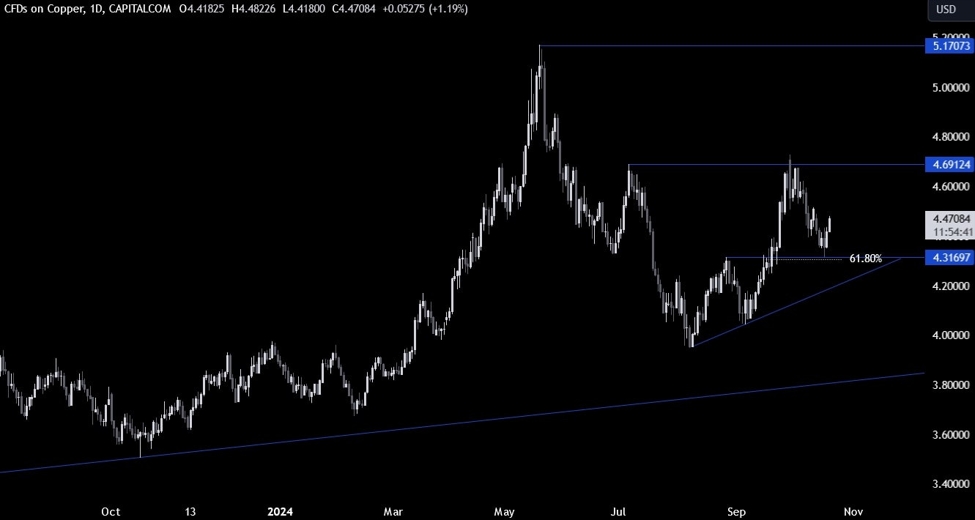
Copper Daily
On the daily chart, we can
see that copper bounced around the 4.32 support zone where we had also the 61.8% Fibonacci retracement level for confluence. This is where the buyers stepped
in and then increased the bullish bets following the new easing measures
announcement from the PBoC.
The sellers will want to
see the price turning around and breaking below the 4.32 support to start
targeting the trendline around the 4.20 level.
Copper Technical
Analysis – 4 hour Timeframe
Copper 4 hour
On the 4 hour chart, we can
see that the price broke above the downward trendline increasing the bullish
momentum as more buyers piled in. The first target should be the swing level at
4.51 which the buyers will need to break to extend the rally into the 4.70
resistance next. The sellers, on the other hand, will likely step in around the
4.51 level to position for a drop back into the 4.32 support.
Copper Technical
Analysis – 1 hour Timeframe
Copper 1 hour
On the 1 hour chart, we can
see that we now have a minor upward trendline defining the current bullish
momentum. The buyers will likely keep on leaning on it to position for further
upside, while the sellers will look for a break lower to position for a drop
back into the 4.32 support. The red lines define the average daily range for today.
Upcoming
Catalysts
This week is pretty empty on the data front with market moving releases scheduled
for the latter part of the week. On Thursday, we get the Flash Japanese and US
PMIs, and the US Jobless Claims figures.


