The price of gold is down over $80 and 3.00% which would rival one of the largest declines seen in the commodity this year. The decline today, comes after five straight days of gains last week.
Geopolitical risks have decreased with the chatter of a cease-fire between Israel and Lebanon. The price of gold is still up over 27.82% on the year which is on pace for its largest gain going back to 2010 when the price surged 29.6%, but sellers are making a play.
With the declines today what is next from a technical perspective?
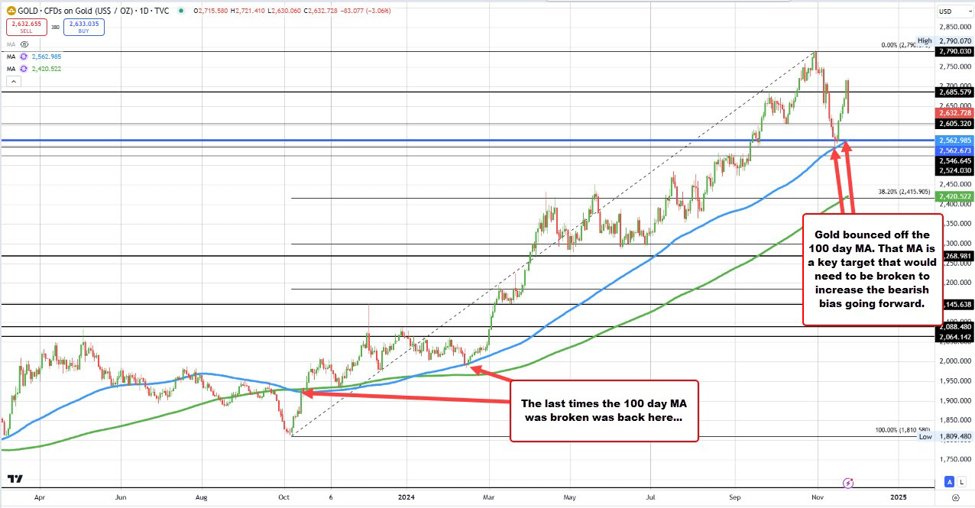
On the downside, of importance is that the low price seen in November bottomed near its rising 100-day moving average (blue line on the chart below) on November 14 and November 15. Stalling against that key moving average level, gave the buyers the go-ahead to push higher last week. It also helped to set that moving average as a key downside target today and going forward.
The current price is still some $60+ dollars away from that level, but it nevertheless, represents a key target going forward. You have to go back to mid-February to for the last time the price traded below that moving average (it was only for a day or so). The last time the price traded for an extended period below the 100-day moving average was back in October 2023.
The 100 day MA is the target. What is the risk? Putting it another way, what would keep the sellers in control at least in the short term?
Earlier today, the price moved lower on the hourly chart and found support buyers against the 100-hour moving average (see blue line on the chart below) . In the North American session, we have seen a move below that moving average and with it more downside momentum. That moving average currently comes in at $2662. It would take a move above that level to disappoint the sellers on the technical break today.
The next targets on the downside, would look toward the 50% midpoint of the move up from the November 14 low. That level comes in at $2628. Below that sits the 200 hour moving average at $2623.05.
Getting and staying below the 200-hour moving average would give sellers more confidence and have them looking down toward the 61.8% retracement at $2606 followed by the 100 day moving average at $2562.67.


