Fundamental
Overview
The USD has been unusually resilient this week despite lots of negative catalysts.
The US PPI and Core CPI came in on the softer side which saw the market increasing the easing
expectations from 24 bps before the data to 37 bps after.
Moreover, yesterday Fed’s Waller delivered some surprisingly dovish comments saying that a rate cut
could come in the first half of this year if the inflation data continues to show
improvement and that a March cut cannot be completely ruled out.
The market pricing increased to 42 bps by year end as a result which is
now much closer to the 50 bps projected by the Fed.
On the JPY side, BoJ’s Ueda said this week that the
central bank will debate whether to raise interest rates next week which gave
the yen a boost as the market increased the probabilities for a rate hike next
week to 78%.
USDJPY
Technical Analysis – Daily Timeframe
USDJPY Daily
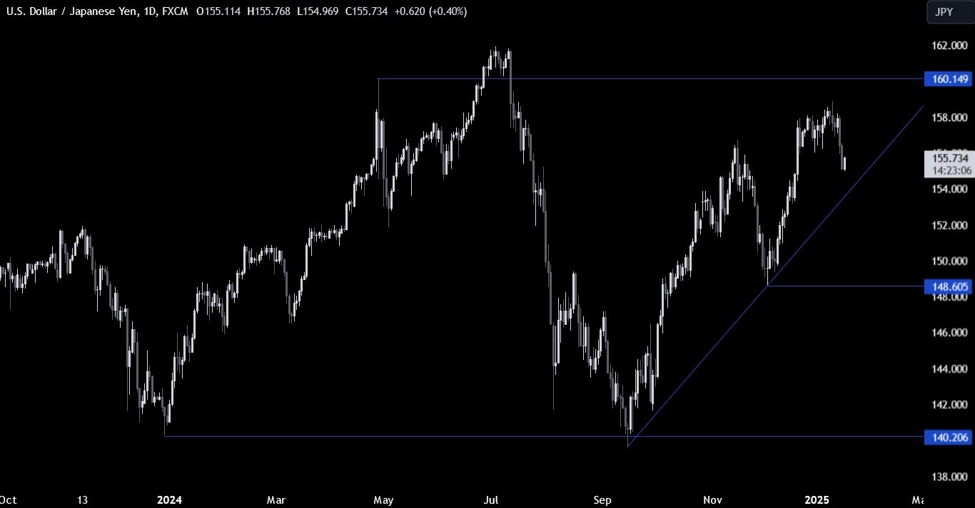
On the daily chart, we can
see that USDJPY broke out of the consolidation following all the JPY positive
news. From a risk management perspective, the buyers will have a better risk to
reward setup around the major trendline to position for a rally into the 160.00
handle. The sellers, on the other hand, will look for a break below the
trendline to extend the drop into the 149.00 handle next.
USDJPY Technical
Analysis – 4 hour Timeframe
USDJPY 4 hour
On the 4 hour chart, we can
see more clearly the breakout of the range with the price now potentially coming
back to retest the support
turned resistance. The sellers will likely keep on piling in around these
levels with a defined risk above the resistance to position for the drop into
the major trendline. The buyers, on the other hand, will want to see the price
breaking higher to start targeting the 158.00 level again.
USDJPY Technical
Analysis – 1 hour Timeframe
USDJPY 1 hour
On the 1 hour chart, there’s
not much else we can add here as the sellers will look for a rejection from the
current levels, while the buyers will look for a rally back above the 156.00
level to position for a move back into the 158.00 level next. The red lines
define the average daily range for today.
Upcoming
Catalysts
Today, we have the US Housing Starts and Building Permits, and the US
Industrial Production and Capacity Utilization.


