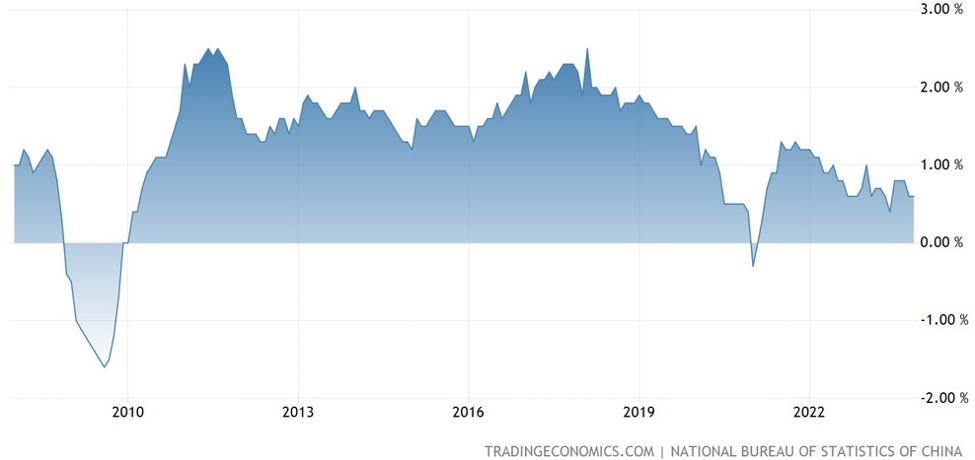
Manufacturing and service are both expected to improve over January. manufacturing is expected to move into expansion.
Looking at recent history:
Manufacturing PMI:
-
July 2024: The manufacturing PMI stood at 49.4, a slight decrease of 0.1 from June, indicating a marginal contraction in manufacturing activity.
-
August 2024: The index declined further to 49.1, suggesting a continued contraction in the manufacturing sector.
-
September 2024: The PMI improved to 49.8, approaching the expansion threshold but still indicating a slight contraction.
-
October 2024: The index reached 50.1, crossing into expansion territory, reflecting a modest recovery in manufacturing activity.
-
November 2024: The PMI increased to 50.3, marking the highest reading since April and indicating a continued expansion in the manufacturing sector.
-
December 2024: The index slightly decreased to 50.1%, maintaining its position above the threshold, thus indicating ongoing, albeit modest, expansion.
- January 2025:
China’s manufacturing PMI fell to 49.1 from 50.1 in December 2024, indicating a contraction in manufacturing activity. This decline was partly attributed to the Lunar New Year holiday, during which many workers returned to their hometowns, leading to reduced production capacity. Additionally, new orders and production sub-indices also experienced declines, reflecting weakened demand and output.
Non-Manufacturing PMI:
-
July 2024: The non-manufacturing PMI was at 50.2, a decrease of 0.3 from June, indicating marginal expansion in the non-manufacturing sector.
-
August 2024: The index declined to 49.6, signaling a contraction in non-manufacturing activities.
-
September 2024: The PMI rebounded to 50.9, returning to expansion territory.
-
October 2024: The index decreased to 50.6, indicating a slower pace of expansion.
-
November 2024: The PMI further declined to 50.0, suggesting stagnation in non-manufacturing activities.
-
December 2024: The index rose to 52.2, reflecting a notable recovery and expansion in the non-manufacturing sector.
- January 2025:
The non-manufacturing PMI, which encompasses the services and construction sectors, decreased to 50.2 in January from 52.2 in the previous month, suggesting a slowdown in growth. The services sector, in particular, was affected by the holiday period, leading to reduced business activity and employment challenges. Despite the slowdown, the index remained above the 50-point threshold, indicating continued, albeit slower, expansion.
Next week we’ll get the privately-surveyed, Caixin, PMIs.
The two PMIs are quite different. If you are unfamiliar with this, the following will set you up!
The PMIs (Purchasing Managers’ Indexes) from China’s National Bureau of Statistics (NBS) and Caixin/S&P Global differ primarily in survey scope, methodology, and focus. Here’s a breakdown of the key differences:
1. Provider and Affiliation
-
NBS PMI:
- Compiled by the National Bureau of Statistics of China, a government agency.
- Seen as the official PMI, closely aligned with government policies and priorities.
-
Caixin/S&P Global PMI:
- Compiled by Caixin Media in collaboration with S&P Global.
- A private-sector index, often considered more market-driven.
2. Survey Scope
-
NBS PMI:
- Focuses on large and state-owned enterprises.
- Covers a broader range of industries, including manufacturing and non-manufacturing sectors (e.g., construction and services).
- Reflects conditions in sectors heavily influenced by government policies and infrastructure spending.
-
Caixin PMI:
- Focuses on small to medium-sized enterprises (SMEs), particularly in the private sector.
- Captures the performance of companies that are more exposed to market-driven forces and less influenced by state interventions.
3. Sample Size and Composition
-
NBS PMI:
- Larger sample size, with about 3,000 enterprises surveyed for the manufacturing PMI.
- Emphasizes state-owned enterprises and larger companies, which tend to dominate traditional industries.
-
Caixin PMI:
- Smaller sample size, surveying around 500 enterprises, with a stronger focus on export-oriented and technology-driven firms.
- Provides insights into the private sector and its responsiveness to global economic conditions.
4. Release Dates
-
NBS PMI:
- Released monthly, typically on the last day of the month.
- Provides separate PMIs for manufacturing and non-manufacturing sectors.
-
Caixin PMI:
- Released a few days later, usually on the first business day of the following month.
- Includes only the manufacturing PMI and services PMI, with no equivalent for non-manufacturing activities like construction.
5. Interpretation and Use
-
NBS PMI:
- Reflects the overall economic landscape, especially trends in industries influenced by government policy.
- Analysts use it to gauge the impact of fiscal and monetary policies on the broader economy.
-
Caixin PMI:
- Viewed as a better indicator of the health of the private sector and market-driven segments of the economy.
- Considered more sensitive to external shocks (e.g., global trade conditions).
6. Key Insights and Differences in Results
- The NBS PMI often reflects policy-driven stability, showing less volatility because it covers sectors cushioned by government support.
- The Caixin PMI can be more volatile, as SMEs are more sensitive to real-time changes in market demand, supply chain disruptions, and global economic shifts.
Why Both Matter:
- NBS PMI offers a macroeconomic view of China’s state-influenced economy.
- Caixin PMI provides a microeconomic perspective of the more market-driven and globally competitive sectors.
By analyzing both, investors and policymakers can obtain a more comprehensive picture of China’s economic health and its underlying dynamics.


