Key Notes
- Onyxcoin (XCN) shot up a staggering 125% in the past week, claiming a high of $0.0212.
- The price surge follows the debut of the Goliath mainnet a few days ago.
- The blockchain protocol is also set to debut the Onyx Smart Wallet.
Onyxcoin
XCN
$0.0199
24h volatility:
3.0%
Market cap:
$663.74 M
Vol. 24h:
$94.74 M
, the native token powering Onyxcoin’s blockchain-based financial infrastructure, has stunned the crypto markets with an explosive rally this past week.
Surging over 125%, XCN has reached a new local high of $0.0212 before pulling back slightly to $0.02017 at the time of writing.
With a market cap of $672 million, the token now sits at 81st on CoinMarketCap, stirring both excitement and skepticism among traders. However, the altcoin is still nearly 90% below its all-time high of $0.1841 seen three years ago.
What’s Fueling the Rally?
The sharp upward move coincides with the launch of Onyxcoin’s Goliath Mainnet, an event that introduces a Proof-of-Stake consensus mechanism, potentially aiming to surpass the transaction speeds of giants like Visa.
The anticipation of increased utility and adoption appears to have drawn in speculative capital, further intensified by momentum traders piling in on breakout signals.
$XCN has shown growth for 3 days in a row due to the launch of the mainnet, which attracts additional liquidity and money attention to itself in anticipation of continued growth.
Those who do not have a position in Onyxcoin, but decided to take on a large risk by buying today,… pic.twitter.com/OXEh9dCjn7
— Grumlin Mystery (@grum1in) April 11, 2025
Another reason for the Onyxcoin price surge is the upcoming launch of the Onyx Smart Wallet which introduces gas-free transactions for the users alongside passkey wallet access, exclusively for the XCN Ledger.
The Onyx Smart Wallet is around the corner for our beta launch with gas-free transactions and passkey wallet access, exclusively for the $XCN Ledger and more! pic.twitter.com/wfBjgN7pru
— Onyx (@OnyxDAO) April 14, 2025
Technical Analysis: What the Charts Say?
At press time, XCN is trading at $0.01997 and perhaps one of the most bullish signs is that the cryptocurrency has captured and held above the 20-day EMA, currently sitting at $0.0145.
The RSI is currently at 71.76, which places it just above the traditional overbought zone. This suggests strong bullish momentum, though a mild correction or consolidation phase could be on the horizon.
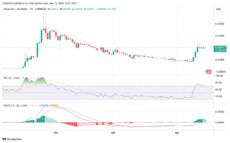
XCN Price Chart | Source: TradingView
The MACD line has crossed above the signal line, and both are rising steadily above the zero line. The growing bullish histogram bars point to increasing buying pressure.
The Fibonacci extensions also offer clear price targets for XCN bulls. The 0.236 Fib level at $0.02452 and 0.382 Fib level at $0.03195 represent resistance levels with another psychologically and technically strong resistance at $0.618 Fib level of $0.04245.
Meanwhile 3.618 and 4.236 Fib extensions go as high as $0.18–$0.21, which aligns with Javon Marks’ ultra-bullish target of $0.1816, representing a 701% upside from current levels, provided the buying demand continues to increase.
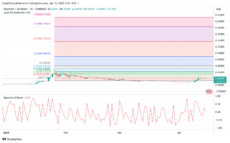
XCN Price Chart | Source: TradingView
Finally, the Balance of Power (BoP) indicator is hovering around neutral at 0.04, after spiking into positive territory. This means that buyers still have some control, but the power struggle is heating up.
A sustained push above 0.2 could signal a more confident bullish trend, while a drop below zero could hint at incoming profit-taking.
Disclaimer: Coinspeaker is committed to providing unbiased and transparent reporting. This article aims to deliver accurate and timely information but should not be taken as financial or investment advice. Since market conditions can change rapidly, we encourage you to verify information on your own and consult with a professional before making any decisions based on this content.

A crypto journalist with over 5 years of experience in the industry, Parth has worked with major media outlets in the crypto and finance world, gathering experience and expertise in the space after surviving bear and bull markets over the years. Parth is also an author of 4 self-published books.