X has launched a revamped UI for its post analytics pages, providing an easier to understand overview of individual post performance over time.
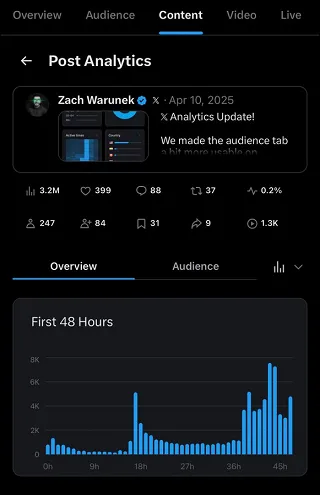
As you can see in this example, posted by X engineer Zach Warunek, the updated post analytics display includes a full overview of all your engagement and reach metrics, including re-posts, shares, video views, Premium viewers, and more.
There’s also a chart showing relative post activity over time (by metric), giving you an additional measure response and engagement.
It’s a handy visual, which could help you better understand general X engagement trends, and how you can tap into user behaviors to maximize performance.
Though it’s only available to X Premium subscribers.
As with all of X’s more recent analytics and feature updates, the company’s using its add-on elements as a lure to attract more Premium user sign-ups, as it looks to make this a more significant revenue stream.
Which hasn’t worked as yet.
According to reports, only around 1.3 million people have signed up to X Premium thus far, which equates to approximately 0.22% of all of X’s 600 million monthly active user base.
Which is not surprising. Add-on subscriptions generally don’t see high demand in social apps, and despite Elon Musk’s initial vision of driving half of X’s revenue from Premium sign-ups, the extras on offer really aren’t enough of a carrot to drive significant interest for most users.
But its enhanced analytics features are worth considering, especially if you’re still looking to drive business growth and engagement via the app. That, of course, relates to fewer businesses than it once did, given the number of brands that have turned away from X due to Musk’s more controversial changes and tweaks.
But if you’re still reaching your audience via X posts, its improved analytics could be another reason to sign up and get yourself a blue checkmark.
Note: X says that audience data for posts will begin to appear after 24 hours.