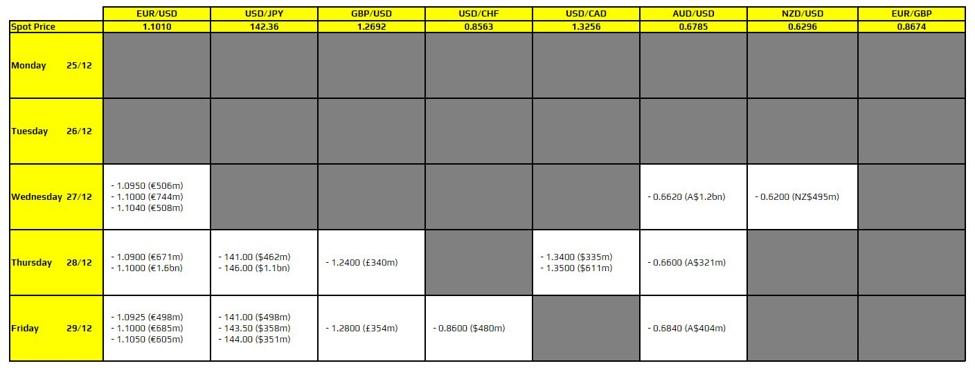
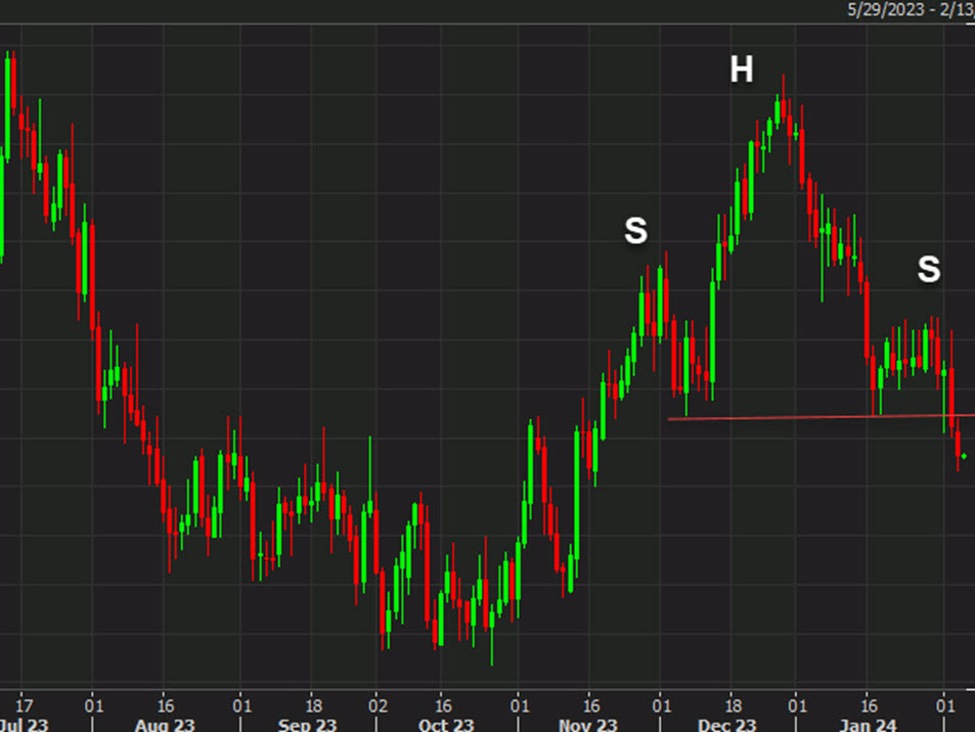
USDCAD moved higher on Wednesday, breaking above both its 100- and 200-hour moving averages (blue and green lines on the chart above) —a bullish technical development. Notably, this marked the first sustained move above the 200-hour moving average since April 9. Back then, the pair briefly breached the level before reversing sharply and trending lower, ultimately bottoming at 1.3827 on April 14 after falling from 1.4260.
Today, however, the upside momentum faded. During the Asia-Pacific session, the pair attempted to hold above the 200-hour moving average (currently near 1.3860), but that level gave way at the start of European trading. The subsequent decline saw the price test the 100-hour moving average, now at 1.38356, with a session low of 1.3839 before a modest bounce.
While the price did manage to briefly move back above the 200-hour MA, it quickly slipped back between the 100- and 200-hour moving averages, putting the pair in neutral short-term territory. These two moving averages are now acting as the key technical barometers.
-
A sustained move below the 100-hour MA would open the door for a retest of this week’s lows near 1.37808. Move below that and the pair is trading at the lowest level since October 2024 and opens the downside for more probing.
-
Conversely, a break back above the 200-hour MA at 1.3860 could revive bullish momentum—though buyers already failed once during the early North American session, which raises doubts about follow-through on the upside.
For now, the battle lines are drawn between the moving averages, and traders will be watching closely for the next directional shove.
ForexLive.com
is evolving into
investingLive.com, a new destination for intelligent market updates and smarter
decision-making for investors and traders alike.


