Data shows the Bitcoin Funding Rate has remained negative during the latest price rally, a sign that short behavior is dominant.
Bitcoin Funding Rates Are Red At The Moment
In a new post on X, on-chain analyst Checkmate has talked about the trend in the Funding Rate of Bitcoin. The “Funding Rate” refers to an indicator that keeps track of the amount of periodic fee that futures market traders are exchanging between each other right now.
When the value of this metric is positive, it means the long contract holders are paying a premium to the short contract ones in order to hold onto their positions. Such a trend suggests a bullish sentiment is shared by the majority of investors on derivatives platforms.
On the other hand, the indicator being under the zero mark implies the short holders are outweighing the long ones and a bearish sentiment is the dominant one.
Now, here is the chart shared by the analyst that shows the trend in the Bitcoin Funding Rate over the last few years:
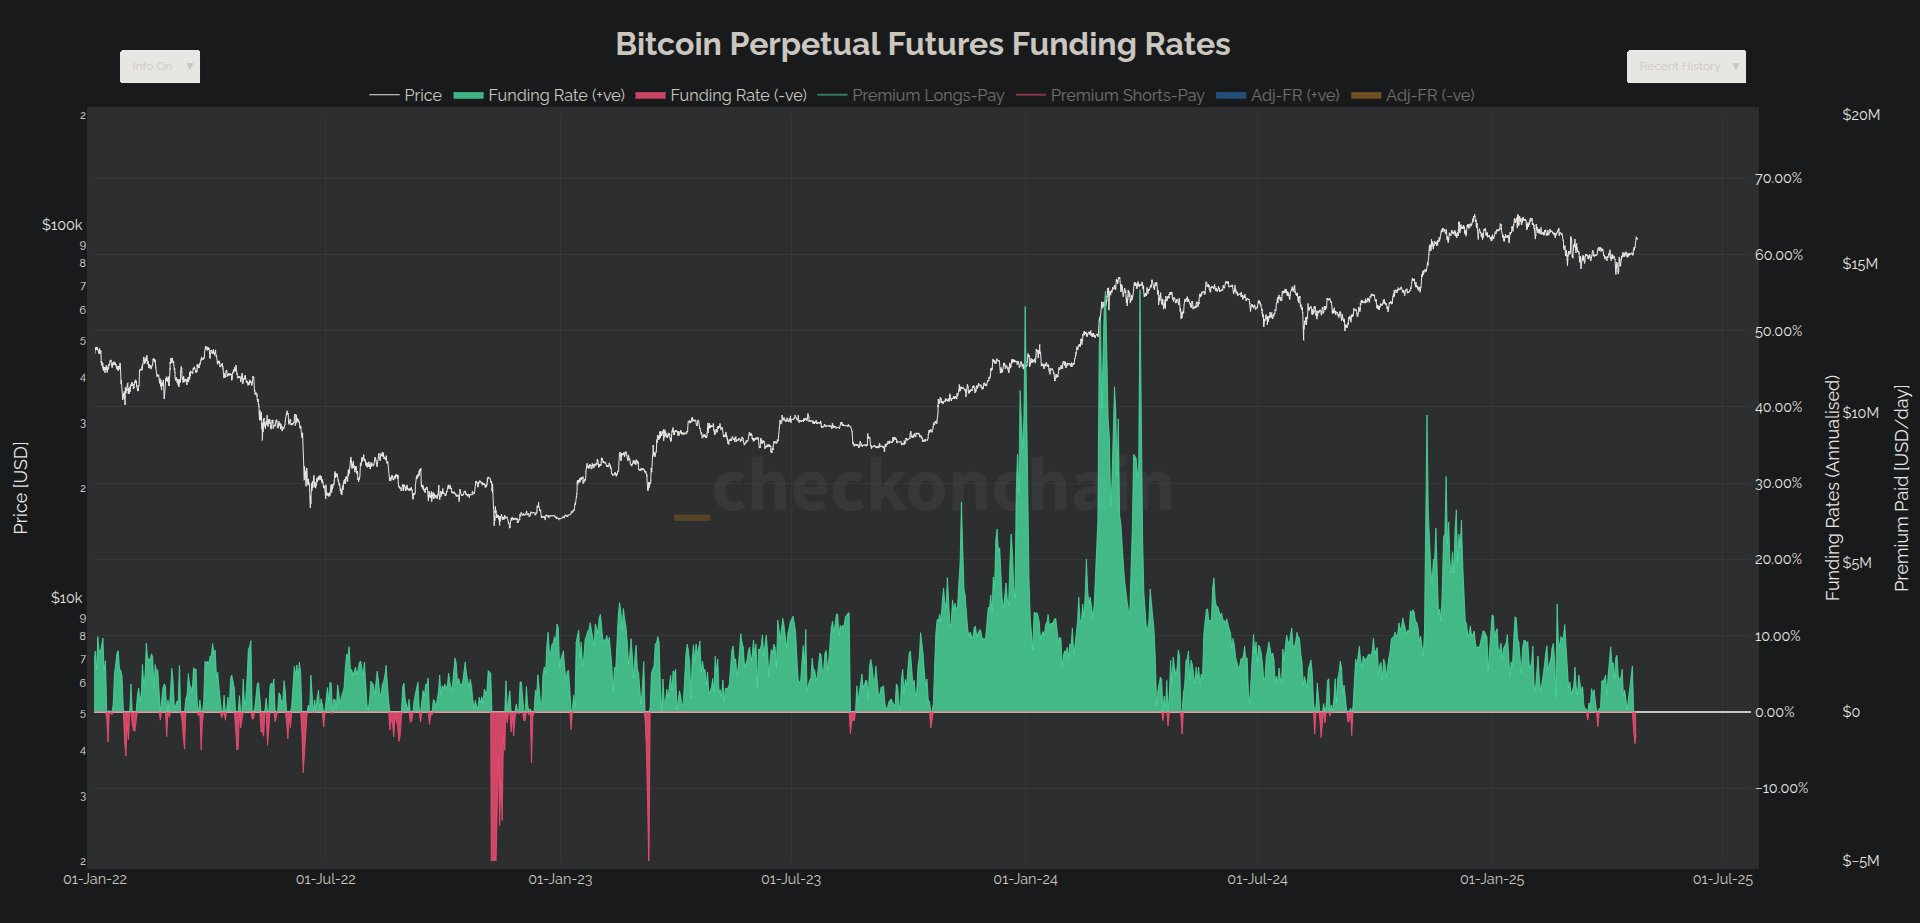
The value of the metric seems to have dipped into the negative region in recent days | Source: @_Checkmatey_ on X
As is visible in the above graph, the Bitcoin Funding Rate has slipped into the negative territory recently, which suggests short behavior has become more dominant on the exchanges.
This trend has interestingly come while BTC has been going through a recovery rally. It would naturally suggest that the futures market users don’t think that this run would last.
This bearish mentality can actually play to the benefit of the cryptocurrency, however, as if demand keeps the rally going, these shorts would end up finding liquidation, thus acting as fuel for the run.
As Checkmate has noted in a reply post, the market has already seen significant short liquidations recently.
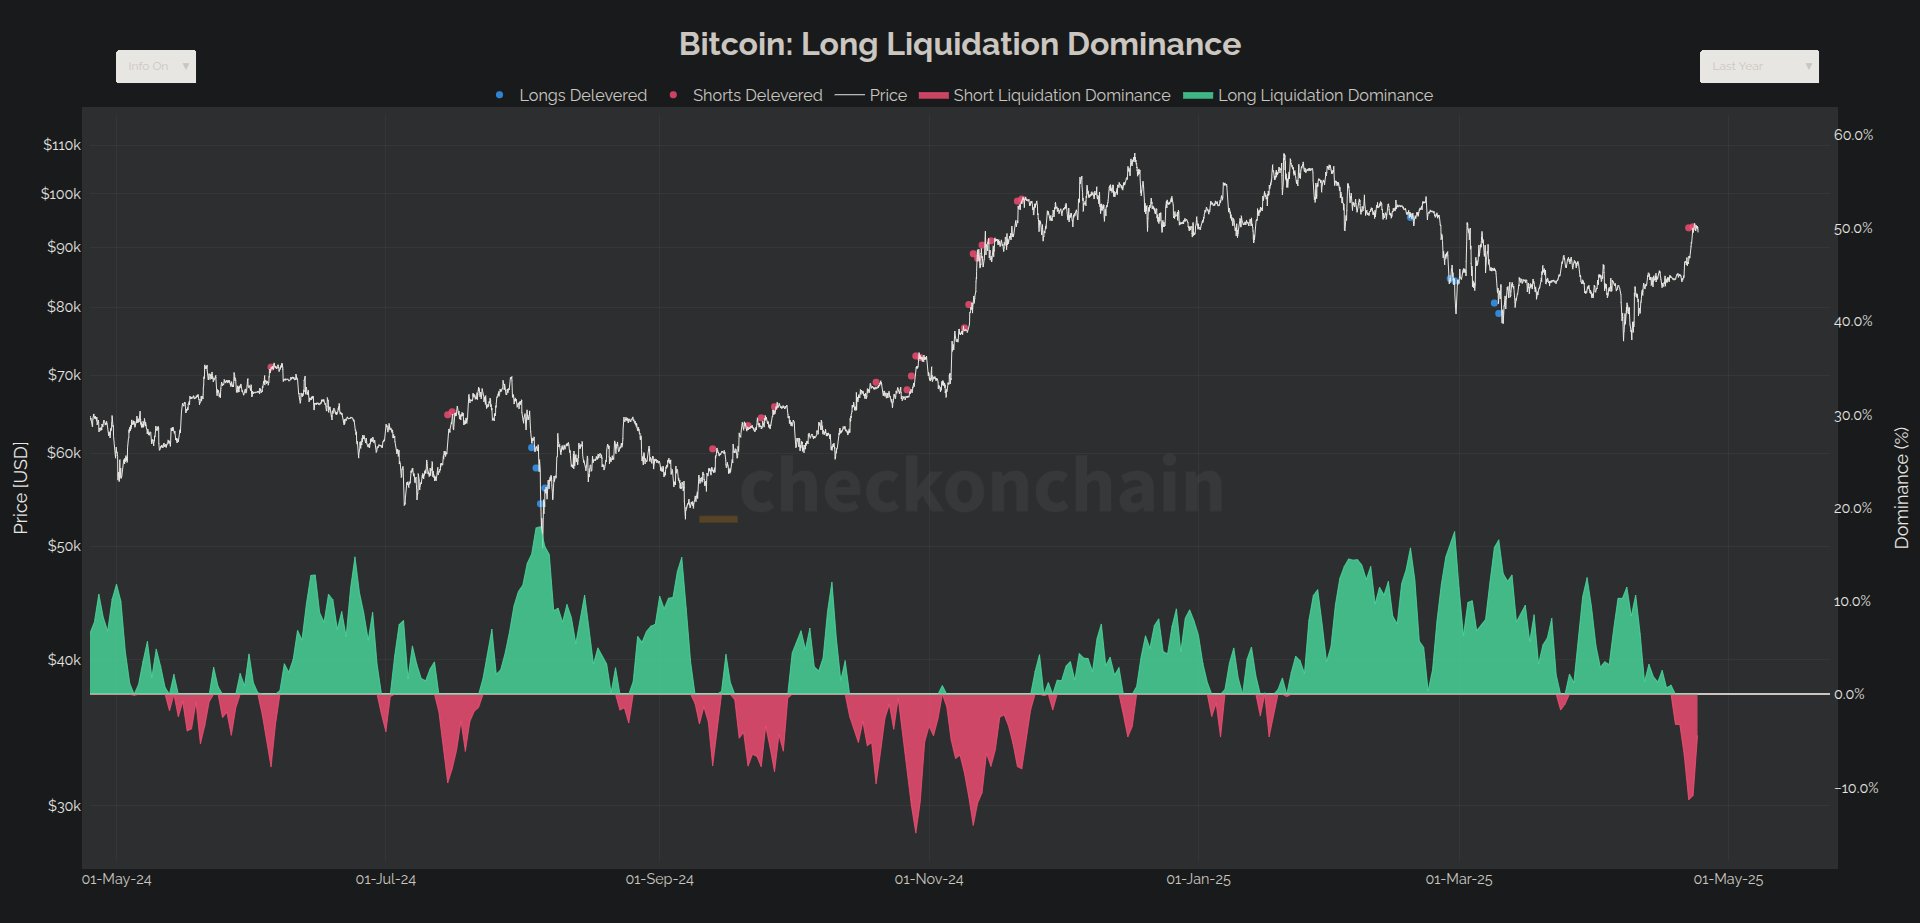
The trend in the long vs short liquidation dominance over the past year | Source: @_checkonchain on X
It now remains to be seen whether this trend of a short squeeze would continue in the coming days, potentially allowing the Bitcoin price recovery rally to keep up.
While futures market users may be getting bearish bets up, the overall sentiment in the cryptocurrency sector has turned bullish following the price surge, as the Fear & Greed Index suggests.

How the Fear & Greed Index has changed during the last twelve months | Source: Alternative
The Fear & Greed Index is an indicator created by Alternative that uses various market factors to determine the sentiment present among the investors of Bitcoin and other digital assets. The metric is currently sitting at a value of 63, which implies a greedy mentality is dominant among the traders.
BTC Price
At the time of writing, Bitcoin is trading around $93,200, up more than 9% in the last seven days.
The trend in the BTC price during the last five days | Source: BTCUSDT on TradingView
Featured image from Dall-E, Alternative.me, chart from TradingView.com
Editorial Process for bitcoinist is centered on delivering thoroughly researched, accurate, and unbiased content. We uphold strict sourcing standards, and each page undergoes diligent review by our team of top technology experts and seasoned editors. This process ensures the integrity, relevance, and value of our content for our readers.