Key Notes
- Sui attracted $11.7M in weekly inflows, surpassing Solana in YTD figures with $84M vs $76M.
- Technical indicators show bullish momentum, with SUI targeting its all-time high of $5.35.
- Sui’s upcoming Vietnam event highlights its push into AI, gaming, and DeFi innovation.
Sui
SUI
$3.65
24h volatility:
5.3%
Market cap:
$12.18 B
Vol. 24h:
$1.76 B
has emerged as one of the best-performing altcoins of the week, outperforming its peers in both price action and investor inflows, as the broader digital asset market recorded its fourth consecutive week of gains.
According to the latest data from CoinShares, digital asset investment products saw a total of $882 million in inflows last week, bringing year-to-date (YTD) inflows to $6.7 billion, closing in on the $7.3 billion peak hit in early February.
Bitcoin dominates inflows
While Bitcoin
BTC
$96 611
24h volatility:
2.1%
Market cap:
$1.92 T
Vol. 24h:
$29.09 B
dominated inflows with $867 million and reached a new milestone of $62.9 billion in net ETF inflows since January, it was Sui that stole the spotlight among altcoins, attracting $11.7 million in inflows.
This not only placed it well ahead of Ethereum
ETH
$1 845
24h volatility:
2.6%
Market cap:
$222.72 B
Vol. 24h:
$14.22 B
, which garnered a modest $1.5 million, but also enabled Sui to overtake Solana
SOL
$150.7
24h volatility:
2.6%
Market cap:
$78.04 B
Vol. 24h:
$3.80 B
in YTD inflows, with $84 million compared to Solana’s $76 million.
CoinShares reports $882M in digital asset inflows last week, the fourth straight week, bringing 2024 YTD total to $6.7B. Bitcoin led with $867M, while Ethereum saw just $1.5M. U.S. crypto ETFs have now reached $62.9B in cumulative inflows. https://t.co/AHt0QEXBhN
— Wu Blockchain (@WuBlockchain) May 12, 2025
In contrast, Solana saw $3.4 million in outflows last week, emphasizing Sui’s growing appeal among investors.
Sui shows signs of retesting ath
The daily chart of the SUI/USDT trading pair reveals a sustained bullish trend, with the price currently at $4.15, up 4,71% on the day.
The Fibonacci retracement from the swing low of $3.12 to the recent local high of $4.97 shows that SUI has reclaimed the 0.618 level ($4.23) and is now targeting the next resistance levels at $4.57 (0.786 Fib) and $4.97 (previous high).
If the bullish momentum continues, a breakout above the $4.20 resistance would confirm the strength of the uptrend, opening the path towards the all-time high (ATH) target of $5.35.
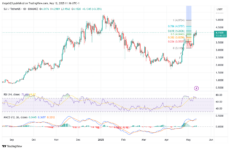
SUI Dail Chart with RSI, MACD, and Fib levels | Source: TradingView
Meanwhile, the Relative Strength Index (RSI) is currently around 72, suggesting strong bullish momentum but also signaling potential overbought conditions.
However, overbought RSI during strong trends often leads to further upside before any meaningful correction.
Meanwhile, the MACD indicator shows a bullish crossover with the MACD line (blue) above the signal line (orange), and positive histogram bars continuing to expand, further validating the current uptrend.
A major upcoming event
Adding fuel to Sui’s bullish narrative is its upcoming flagship event, “The Great Sui Odyssey #5,” taking place on May 17 in Vietnam. The event will showcase how Sui is driving innovation in AI, gaming, and DeFi for developers.
🇻🇳 The Great Sui Odyssey #5 by @Suci_Community – Discover how Sui enables scalable, builder-friendly dApps in AI, Gaming, DeFi, Art, and beyond.
📅 Saturday, May 17
🕖 14:00 – 17:00 GMT+7
📍SuiHub, Vietnam✅ Register nowhttps://t.co/SROxCY2VRc
— Sui (@SuiNetwork) May 11, 2025
With its high throughput, dynamic assets, and scalable infrastructure, Sui is enabling cutting-edge applications like Large Language Models (LLMs) in decentralized ecosystems.
Disclaimer: Coinspeaker is committed to providing unbiased and transparent reporting. This article aims to deliver accurate and timely information but should not be taken as financial or investment advice. Since market conditions can change rapidly, we encourage you to verify information on your own and consult with a professional before making any decisions based on this content.

A crypto journalist with over 5 years of experience in the industry, Parth has worked with major media outlets in the crypto and finance world, gathering experience and expertise in the space after surviving bear and bull markets over the years. Parth is also an author of 4 self-published books.