

Bitcoin saw a sharp reversal on Sunday, surging to $107,000 before retracing over 4% in just a few hours — a classic fakeout that has left the market shaken. The rejection at local highs has sparked debate among top analysts: some warn of a looming correction as BTC struggles to break into price discovery, while others remain bullish, expecting a breakout above the all-time high around $109,000. This volatility underscores growing investor uncertainty amid a lack of clear macro drivers.
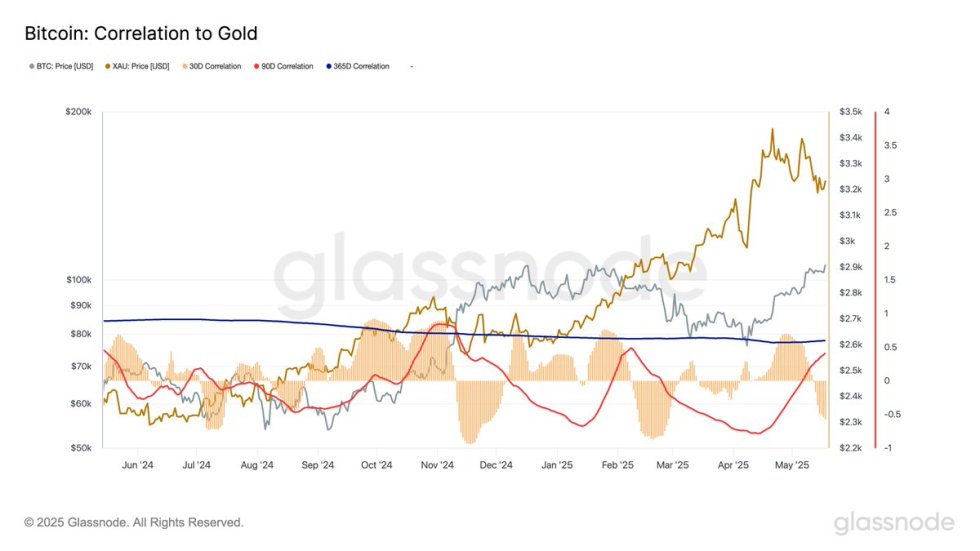
Glassnode data adds an interesting dimension to this setup: Bitcoin’s short-term correlation to gold has dropped to -0.54 over the past 30 days, the lowest since February. In other words, Bitcoin may be entering a unique phase where it trades more independently of traditional safe havens. As BTC consolidates around key levels, the coming days could bring heightened volatility and critical price action. The market now watches closely to see if bulls will reclaim momentum — or if a deeper correction is on the horizon.
Bitcoin Support Faces Pressure As Correlation With Gold Hits Low
Bitcoin is currently navigating a critical zone, with bulls urgently defending the $100,000 mark to maintain bullish momentum. After briefly touching $107,000 over the weekend, BTC experienced a sharp 4% retrace, signaling growing indecision and sparking a wave of concern among investors. The price now hovers near key short-term support, and while the long-term structure remains bullish, failure to hold $100K could trigger further downside into lower demand zones.
Despite the sell-off, many traders believe the path forward still holds upside potential. Liquidity clusters remain just above the $105,000 level, and a breakout above this region could ignite a rally into new all-time highs near $109,000. However, the lack of follow-through following Sunday’s breakout attempt has shaken market sentiment, with some participants anticipating a broader correction before any sustained move higher.
Glassnode data adds another layer to the analysis. Over the past 30 days, Bitcoin’s short-term correlation to gold has dropped to -0.54, the lowest since February, suggesting BTC is diverging from traditional safe havens in the current macro environment. Meanwhile, its 90-day and 365-day correlations to gold remain positive at 0.39 and 0.60, respectively. This indicates that although Bitcoin still shares medium- to long-term behavioral patterns with gold, its short-term performance is increasingly driven by crypto-native market forces and speculation.
As Bitcoin consolidates and prepares for its next move, all eyes are on the $100K support level and the $105K-$109K resistance zone. If bulls can defend this key structure and reclaim momentum, the stage will be set for price discovery. But if support fails, a deeper retracement could follow — possibly resetting bullish expectations in the short term.
Bitcoin Pulls Back After Rejection – Key Support In Focus
Bitcoin’s price action on the daily chart reveals a sharp rejection near the $107,000 level, followed by a swift retracement to the $103,000 zone. The recent wick to the upside marked a potential fakeout above previous resistance, indicating heavy selling pressure at the highs. This has triggered a 3.36% pullback on the day, with BTC currently trading around $102,943.
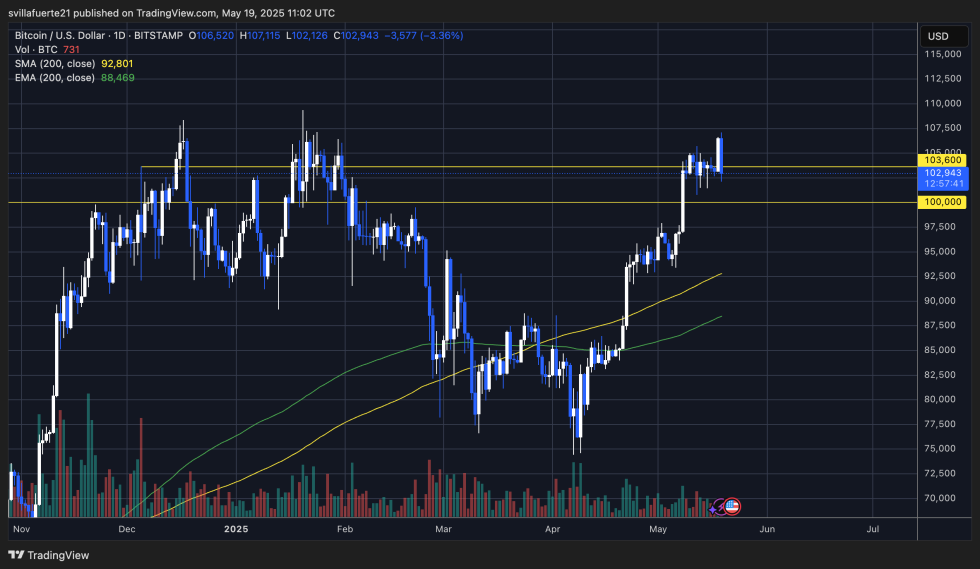
Despite the drop, the broader structure remains bullish as long as Bitcoin stays above the critical $100,000 support level. The 200-day SMA at $92,801 and the EMA at $88,469 offer deeper structural support, but bulls will aim to defend the psychological $100K mark to maintain momentum. A daily close below $100K could invite further selling and shake confidence in the current rally.
Volume on the retracement is notable but not extreme, hinting that the selloff may still be part of a broader consolidation rather than a full trend reversal. For upside confirmation, BTC must reclaim and hold the $105,000–$107,000 area to challenge its all-time high near $109K. Until then, traders should watch for price stability above $100K or risk a deeper correction as volatility remains elevated.
Featured image from Dall-E, chart from TradingView
Editorial Process for bitcoinist is centered on delivering thoroughly researched, accurate, and unbiased content. We uphold strict sourcing standards, and each page undergoes diligent review by our team of top technology experts and seasoned editors. This process ensures the integrity, relevance, and value of our content for our readers.