Fundamental
Overview
Gold remained supported since
last Thursday following an in-line US CPI report and surprisingly weak initial jobless claims. The jobless claims data stole the
show as initial claims jumped to a new cycle high and the highest level since
2021.
Eventually, it turned out
that the spike in initial claims was caused by an increase in fraudulent claim
attempts in Texas. Therefore, in light of this new information, jobless claims
still point to a resilient labour market and the fall in continuing claims
could actually be an early signal of improvement.
Nonetheless, the dovish
positioning into the FOMC decision remined a tailwind for the market and might
not end until we get to the actual decision or a catalyst triggers a pullback.
In the bigger picture, gold
should remain in an uptrend as real yields will likely continue to fall amid
the Fed’s dovish reaction function. In the short-term though, hawkish repricing
in interest rates expectations will likely keep on triggering corrections.
Gold
Technical Analysis – Daily Timeframe
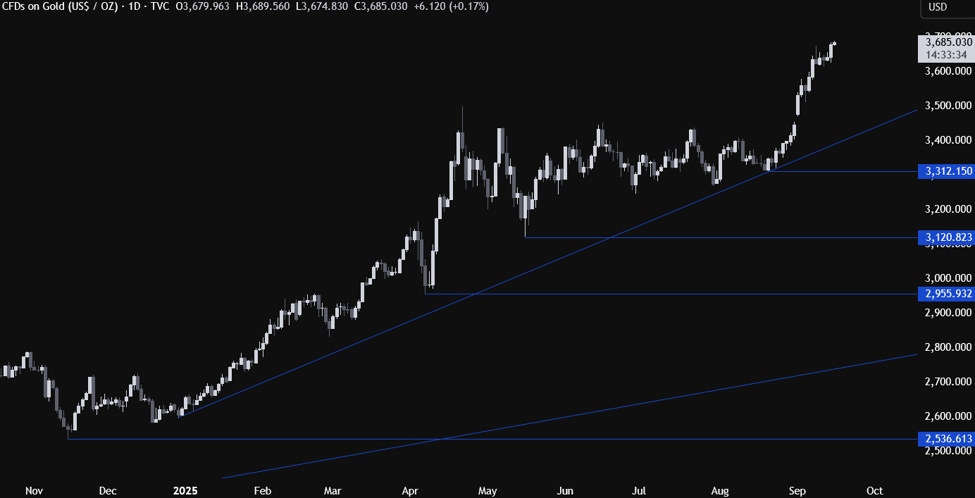
Gold Daily
On the daily chart, we can
see that gold extended the rally into a new all-time high yesterday as the
dovish positioning into the FOMC decision continued to be a tailwind for the
buyers. From a risk management perspective, the buyers will have a better risk
to reward setup around the major trendline at the 3,400 level, while the
sellers will look for a break lower to extend the drop into the 3,120 level
next. Such a big correction looks unlikely though unless we get strong data in
the next months and a hawkish repricing in interest rates expectations.
Gold Technical Analysis
– 4 hour Timeframe
Gold 4 hour
On the 4 hour chart, we can
see that we have a minor upward trendline defining the bullish momentum. If we
get a pullback into the trendline, we can expect the buyers to lean on it with
a defined risk below it to keep pushing into new highs. The sellers, on the
other hand, will look for a break lower to increase the bearish bets into the major
trendline around the 3,400 level.
Gold Technical Analysis
– 1 hour Timeframe
Gold 1 hour
On the 1 hour chart, we can
see that the price is not consolidating right above the most recent all-time
high which is acting as a minor support.
We can expect the buyers to keep piling in around these levels with a defined
risk below the 3,675 level to keep pushing into new highs. The sellers, on the
other hand, will want to see the price falling below the level to position for
a drop back into the 3,620 support. The red lines define the average daily range for today.
Upcoming
Catalysts
Today we get the US Retail Sales data. Tomorrow, we have
the FOMC policy announcement. On Thursday, we get the latest US Jobless Claims
figures.