Below is the article copy that wraps your video and keeps the focus on structure – not a sea of indicators.
Why simplicity wins with this Nvidia stock analysis (no indicators!)
Price leaves footprints. When you remove the clutter and look for the simple story, structure begins to speak. In this video we keep the chart clean – no moving averages, no oscillators – only a working channel, one orange decision box, and clear price levels.
The long-term setup for NVDA stock – channel first, everything else second
-
Two touch points build the channel at the top and bottom. That structure acts like a classic bull flag – a controlled pause after a strong advance.
-
Breakout quality matters. We highlight a decisive breakout candle near 4.5 percent that did not bother to retest the channel. That kind of impulsive follow-through often signals buyers were too eager to wait for a textbook pullback.
-
Repricing zone. After the break, price built a new box of value – think of it as a fresh agreement about what the company is worth. Near the top of that box, supply says “too rich – I will sell.” Near the bottom, demand says “too cheap – I will buy.” Simple, visible, actionable.
Scenarios to respect in the above NVDA technical analysis setup
-
Failed break and buy-the-dip
If price breaks down out of the channel and cannot quickly reclaim it, our interest shifts to the 148 to 144 area. That is where the reward-to-risk can tilt in favor of longs, with eyes on a return to the broken structure and, if momentum rebuilds, a run at new all-time highs later. -
No-fuss continuation
If price holds above the orange box and keeps accepting higher, treat pullbacks into that box as potential support until proven otherwise.
The orange box is your activation zone – acceptance above is constructive, acceptance below says stand aside or prepare for the lower buy area.
One practical charting tip – the 23 hour view
In TradingView, use a 23 hour session view on intraday time frames to surface pre-market offshoots that a daily chart can hide. It is a quick way to spot levels that mattered when most traders were not looking. The video demonstrates exactly where this adds context.
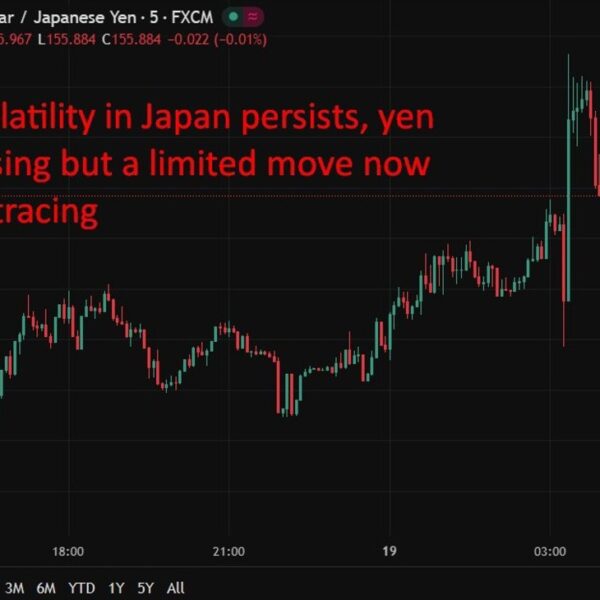
Macro backdrop in one line
Context matters even for single names like NVDA. As investingLive’s Americas FX wrap summarized after Chair Powell’s remarks, “Our policy is not on a preset course.” That cautious stance can keep markets sensitive to data and headlines, which is why we focus on clear levels and simple confirmations. Read the wrap here. investingLive, formerly ForexLive.
NVDA Chart Shown in the Video: Levels at a glance
-
Channel – the big blue rails define the bull flag.
-
Breakout impulse – the 4.5 percent candle that skipped a retest.
-
Repricing box – the new value area created after the break.
-
Buy zone – 148 to 144 if the break fails and price resets lower.
-
Decision box – the orange area that tells you who is winning right now.
How to use this NVDA technical roadmap
-
If price sustains above the orange box, bias is bullish, look for a retest for a possible entry.
-
If price falls below the consolidation area of ‘box’ (yellowish channel in the vide above), bias is bias is bearish – ideally wait for a retest and then go short (always at your own risk, this is not financial advice!).
-
If price accepts below the orange box, bias shifts down toward 148 to 144 where we reassess for a long.
Risk rules
-
Set your stop just beyond your activation threshold with a small buffer. Have a ‘I am wrong’ threshold or price as well (AKA stop). Never place a stop beyond the opposite threshold. If price breaches the opposite threshold the setup is invalid and you should already be out.
-
To mitigate risk, you can set a 1st profit target (TP1) and after it is reached, move the stop to entry to protect gains and manage the runner.
Education corner – keep it simple
Many times, the best guidance is given to us from SIMPLE charts without any chart indicators. But look for the STORY the chart is telling you. The video above shows a real good example, regardless if you are intersted in doing technical analysis of Nvidia, and regardelss of when. It is a good example for any time.
Decision support only – not investment advice. Trade at your own risk.