Fundamental
Overview
The FOMC decision last week
was mostly in line with expectations with a 25 bps rate cut and the Fed placing
more focus on the labour market now given the recent weakness in the data. The
dot plot was more hawkish compared to market’s pricing, which makes sense given
that Fed Chair Powell labelled the rate cut as a “risk management” move.
This means that they are
cutting rates just because of the recent weakness in the labour market. If the
labour market were to improve, the Fed would start turning more hawkish and
might even hold off on the expected rate cuts. For now though, this Fed support
is bullish for the stock market.
Problems arise when the
economy gets too hot and that’s when the Fed support wanes and the central bank
starts to work against the market. And this is where we could get the pullbacks
(and eventually even a crash).
Right now, the market is
pricing 109 bps of easing by the end of 2026 compared to just 75 bps projected
by the Fed. This means that the market is too optimistic. Therefore, a hawkish
repricing in those expectations should in theory trigger pullbacks in all
asset classes. So, if you are waiting for a pullback, then wait for US data. If
we get strong US data (especially with the NFP report next week), then we will likely get a deeper pullback which could take us back to the FOMC low.
Once the market pricing gets back in line with
the Fed’s projections, then the stock market should restart its rally. In fact, as long as the
Fed’s reaction function remains dovish, the downside will remain limited. This
“melt-up” phase will likely go on as long as the Fed remains more
focused on the labour market. Once inflation starts to become a serious worry (most likely if it moves above 3%),
that’s when we will finally get a meaningful correction (or even a bear market
if the Fed opens the door for rate hikes). Until then, the pullbacks will just be
dip-buying opportunities.
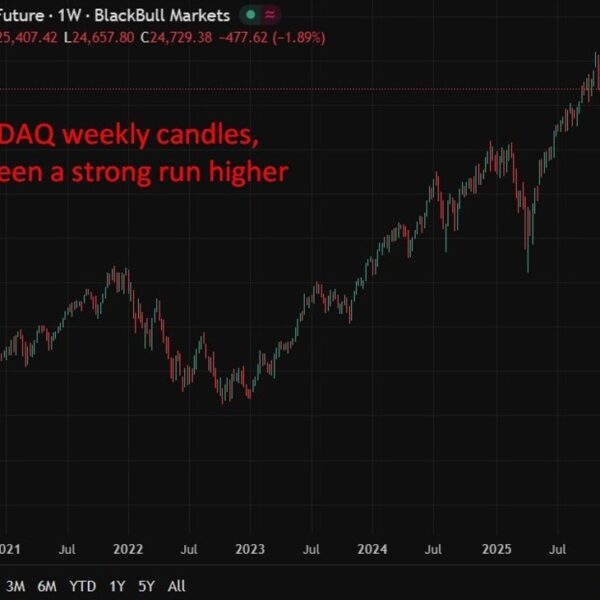
Nasdaq
Technical Analysis – Daily Timeframe
Nasdaq daily
On the daily chart, we can
see that the Nasdaq pulled back a bit from the all-time highs. From a risk management
perspective, the buyers will have a much better risk to reward setup around the
major trendline
where they can pile in with a defined risk below the trendline and target a new
all-time high. The sellers, on the other hand, will want to see the price
breaking below the trendline to extend the drop into the 23,000 level next.
Nasdaq Technical
Analysis – 4 hour Timeframe
Nasdaq 4 hour
On the 4 hour chart, we can
see that we had a minor upward trendline defining the bullish momentum on this
timeframe. Yesterday, we got a break to the downside. We can expect the sellers
to pile in around these levels with a defined risk above the trendline to keep
targeting a deeper pullback into the 24,245 level. The buyers, on the other
hand, will want to see the price rising back above the trendline to pile in for
a rally into a new all-time high.
Nasdaq Technical Analysis – 1 hour Timeframe
Nasdaq 1 hour
On the 1 hour chart, we can
see that we have a minor downward trendline defining the current pullback. The
sellers will likely lean on the trendline with a defined risk above it to
position for a drop into the 24,245 level, while the buyers will look for a
break higher to pile in for a rally into a new all-time high. The red lines
define the average daily range for today.
Upcoming Catalysts
Today we get the latest US Jobless Claims figures. Tomorrow,
we conclude the week with the US PCE report.