Fundamental
Overview
Last week’s gold’s impressive
resilience in the face of major headwinds coming from strong US data, higher
yields and surging US dollar proved to be a signal of underlying strength. In
fact, as soon as the week started, gold surged into new all-time highs.
There might be some fears
of the looming US government shutdown at the moment, but if that is cleared,
the focus will turn to the upcoming US data with the NFP report on Friday being
the main event.
In the bigger picture, gold
should remain in an uptrend as real yields will likely continue to fall amid
the Fed’s dovish reaction function. In the short-term though, hawkish repricing
in interest rates expectations caused by strong US data will likely keep on triggering
corrections.
Gold
Technical Analysis – Daily Timeframe
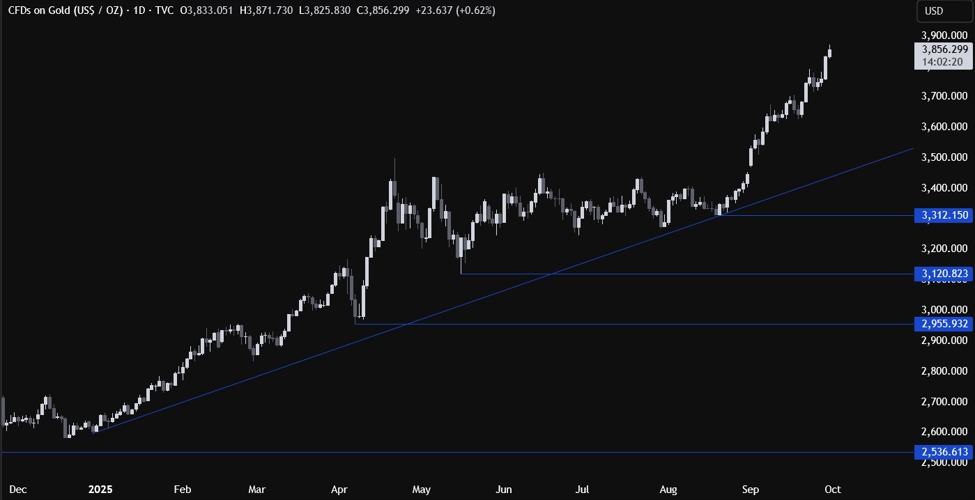
Gold daily
On the daily chart, we can
see that gold extended the rally into yet another all-time high. From a risk
management perspective, the buyers will have a better risk to reward setup around
the major trendline, while the sellers will look for a
break lower to extend the drop into the 3,120 level next. Such a big correction
though, will likely need strong US data to trigger a hawkish repricing in
interest rates expectations.
Gold Technical Analysis
– 4 hour Timeframe
Gold 4 hour
On the 4 hour chart, we can
see that we have another upward trendline defining the bullish momentum on this
timeframe. If we get a pullback into the trendline, we can expect the buyers to
lean on it with a defined risk below it to position for a rally into a new
all-time high. The sellers, on the other hand, will want to see the price
breaking lower to pile in for a drop into the 3,627 level next.
Gold Technical Analysis
– 1 hour Timeframe
Gold 1 hour
On the 1 hour chart, we can
see that we have yet another minor upward trendline on this timeframe. The
buyers will likely lean on the trendline with a defined risk below it to keep
pushing into new highs, while the sellers will look for a break lower to pile
in for a pullback into the 3,790 support. The red lines define the average daily range for today.
Upcoming
Catalysts
Today we get the US Job Openings data and the US Consumer
Confidence report. Tomorrow, we have the US ADP and the US ISM Manufacturing
PMI. On Thursday, we get the latest US Jobless Claims figures. On Friday, we
conclude the week with the US NFP report and the US ISM Services PMI. Keep also
an eye on Fed speakers.