Fundamental
Overview
Gold managed to extend the
rally into yet another all-time high yesterday despite lack of meaningful catalysts
this week. We got a very weak US
ADP report yesterday but that didn’t trigger another rally despite the
market pricing turning more dovish. The ISM
Manufacturing PMI was overall good with a higher employment index and a lower inflation index.
Unfortunately, we are now working
with just the private sector data as the US government shutdown is delaying all
the government data like Jobless Claims and highly likely the NFP report. Depending
on the length of the shutdown, even the US CPI could be in jeopardy.
The market might keep on drifting
higher by inertia given the lack of catalysts or we could get stuck in a
consolidation. In the bigger picture, gold should remain in an uptrend as real
yields will likely continue to fall amid the Fed’s dovish reaction function. In
the short-term though, hawkish repricing in interest rates expectations caused
by strong US data will likely keep on triggering corrections.
Gold
Technical Analysis – Daily Timeframe
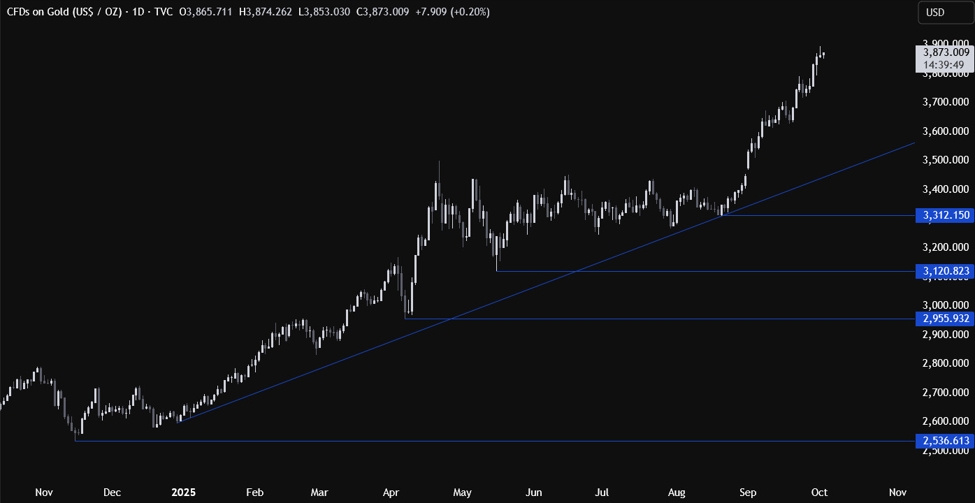
Gold daily
On the daily chart, we can
see that gold extended the rally into yet another all-time high yesterday
before pulling back a bit. From a risk management perspective, the buyers will
have a better risk to reward setup around the major trendline, while the sellers will look for a
break lower to extend the drop into the 3,120 level next. Such a big correction
though, will likely need strong US data to trigger a hawkish repricing in
interest rates expectations.
Gold Technical Analysis
– 4 hour Timeframe
Gold 4 hour
On the 4 hour chart, we can
see that we have another upward trendline defining the bullish momentum on this
timeframe. If we get a pullback into the trendline, we can expect the buyers to
lean on it with a defined risk below it to position for a rally into a new
all-time high. The sellers, on the other hand, will want to see the price
breaking lower to pile in for a drop into the 3,717 level next.
Gold Technical Analysis
– 1 hour Timeframe
Gold 1 hour
On the 1 hour chart, we can
see that we have yet another minor upward trendline on this timeframe. The
buyers will likely lean on the trendline with a defined risk below it to keep
pushing into new highs, while the sellers will look for a break lower to pile
in for a pullback into the 3,790 support.
The red lines define the average daily range for today.
Upcoming
Catalysts
Tomorrow we conclude the week with the US NFP
report (in case government funding is restored) and the US ISM Services PMI.
Keep also an eye on Fed speakers.