tradeCompass Key Price Levels for S&P 500 Futures, with orderFlow Intel
This S&P 500 analysis focuses on how yesterday’s order flow structure continues to shape today’s trade dynamics. Rather than treating today as a clean reset, orderFlow Intel shows that the market is still working through an unfinished auction from the prior session.
As a result, this S&P 500 forecast today is less about momentum and more about value control, acceptance, and rejection around clearly defined price levels.
Recent Market Developments for the S&P 500
Broader macro and cross-asset signals remain mixed. In the U.S., softer recent jobs data has reinforced expectations that the Federal Reserve could begin cutting rates earlier than previously anticipated next year, according to CIBC, adding a layer of uncertainty to near-term equity positioning. At the same time, currency markets remain active, with the Reserve Bank of India continuing FX intervention efforts to stabilize the rupee, highlighting the ongoing sensitivity to capital flows and dollar dynamics. In crypto markets, as I show in my technical analysis video, Ethereum futures remain under technical pressure, with recent analysis pointing to a %12.5 downside scenario as the dominant path unless key resistance levels are reclaimed. Together, these developments underline a market environment where policy expectations, currency stability, and risk appetite remain closely intertwined, but I would say the tendency is still to the bearish side. And that is what the recent orderFlow Intel reports show as well. orderFlow Intel is a proprietary analysis method used on investingLive.com that combines real-time order flow, volume, and AI to reveal buyer and seller control beneath price, helping traders understand why markets move and where momentum may continue or reverse.
What happened yesterday in S&P 500 futures and why it matters today
Yesterday’s S&P 500 futures session moved through several important structural phases.
Early selling pushed price lower, with acceptance below value and a session low near 6817. That downside move did not turn into panic or liquidation. Buyers responded and managed to rotate price back into the value area, leading to a repair phase into the U.S. close.
Late in the session, price briefly pushed above the Value Area High near 6866–6870, triggering stops and breakout attempts. However, orderFlow Intel showed that this move lacked acceptance. Value did not migrate higher, and price quickly rotated back toward VWAP. This marked a false breakout, not a bullish transition.
The market closed inside value, but with lower highs and unresolved seller pressure. That context is critical for today’s S&P 500 technical analysis.
How today’s S&P 500 session connects to yesterday
Today’s open reflected that unfinished auction.
Instead of opening with strong directional intent, S&P500 futures rotated around yesterday’s Point of Control near 6855, repeatedly testing it from both sides. Buyers showed activity, but orderFlow Intel confirmed that they were unable to relocate value higher.
At the same time, sellers did not press aggressively lower. This created a range with a bearish tilt, rather than a clean trend.
Key value references shaping today’s S&P 500 prediction today:
As long as price remains below 6855, sellers retain the structural edge.
tradeCompass directional framework for S&P 500 futures
Primary bias
Slight bearish bias, unless price reclaims and sustains above the upper value thresholds.
This is not a high-momentum sell environment. It is a controlled auction where downside targets are worked step by step if sellers continue to control value.
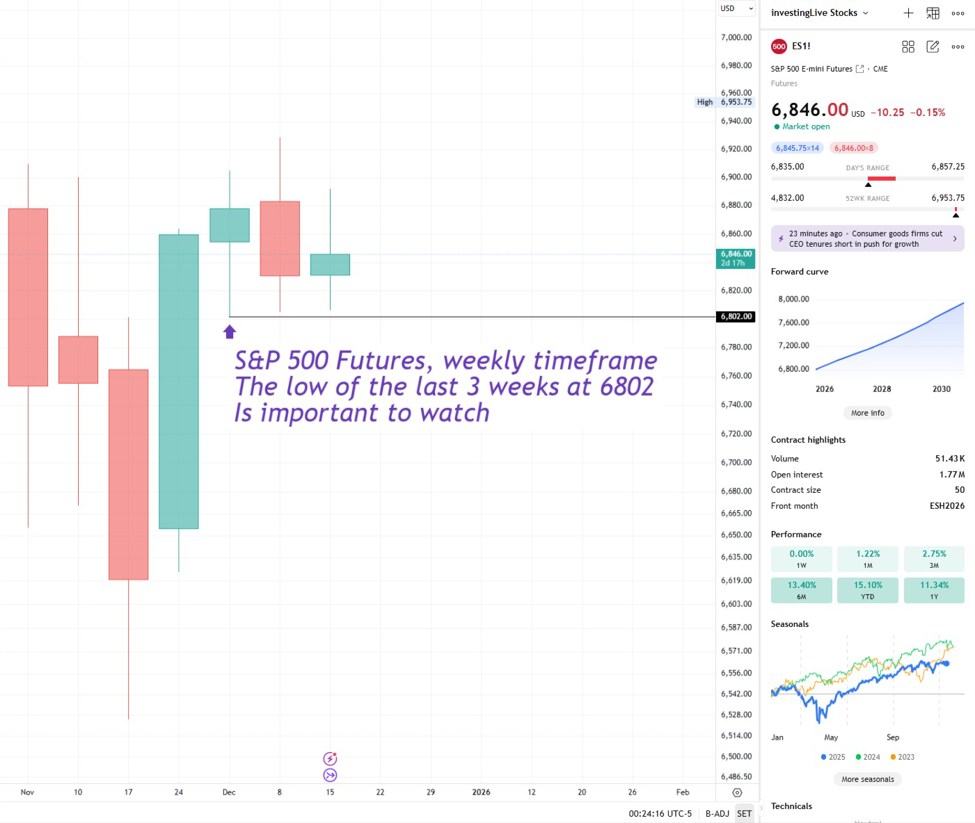
S&P 500 weekly, a technical analysis showing low to watch
Bearish S&P 500 scenario
Bearish activation:
Sustained trade below 6855, especially if retests into that area fail.
orderFlow Intel context (high level):
-
Selling is being accepted rather than immediately reversed
-
Buyers show activity but fail to hold higher prices
-
Value continues to build at or below lower references
Bearish profit targets:
-
TP1: 6836
Positioned safely above yesterday’s VAL at 6834.5. -
TP2: 6829
A known liquidity pool from November 25. -
TP3: 6810.50
-
TP4: 6801.75
Just above the psychological 6800 round number. -
TP5: 6781.75
Trade management:
After TP1 is reached, move the stop on the remaining position to entry (breakeven).
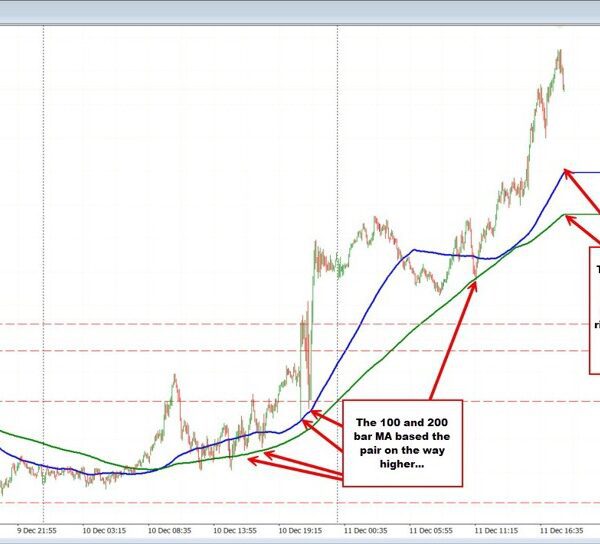
On the broader view, this pitchfork on the 4h chart of ES1! (S&P 500 Emini Futures) is acting like an activated bear flag. Bulls must push and get price to re-enter that pitchfork’s channel to reignite the bull premise. According to this perspective, bears are looking better then bulls, till that changes. And 6800 round number might be tested later today. I bet market makers wouldn’t mind hunting stops below that key level.
4hr chart s&p500 shows this pitchfork as a bear flag
Bullish S&P 500 scenario
Bullish activation:
Sustained trade above 6869–6871, with acceptance and follow-through.
This zone represents a cluster of prior value and VWAP memory. Buyers must prove control here for the S&P 500 forecast today to turn bullish.
orderFlow Intel context:
-
Value must migrate higher, not just spike
-
Pullbacks should remain shallow
-
Sellers should fail to push price back into the prior range
Bullish profit targets:
Trade management:
After TP1 is reached, move the stop on the remaining position to entry (breakeven).
Stop placement rule
Stops should be placed just beyond the activation threshold, with a small buffer.
Never place a stop beyond the opposite threshold.
If price sustains beyond the opposite threshold, the setup is invalid and you should already be out. Learn more about the tradeCompass principles here: https://investinglive.com/Education/welcome-to-tradecompass-a-trusted-map-for-traders-20251103/
Sometimes, we even dish out live updates, not seen on the investingLive website, which are given on our Telegram Channel, learn more about that here: https://investinglive.com/Education/join-the-investinglive-telegram-channel-live-trades-and-real-market-discipline-20251103/
Final S&P 500 takeaway
This S&P 500 technical analysis is not about predicting a breakout. It is about identifying who controls value.
-
Below 6855, sellers retain the edge and downside targets remain in play.
-
Above 6869–6871, buyers regain control and higher value becomes possible.
Until one of those conditions is met, expect range behavior with a bearish tilt, driven by acceptance and rejection around key value levels rather than impulsive momentum.
Decision support only. Trade the S&P 500 at your own risk only.