Looking to get a better handle on your social media performance, and what you can expect to see from your social marketing and promotion efforts?
This will help. The team from Socialinsider recently published their latest social media marketing benchmarks report, which looks at average performance stats based on 70 million total posts across TikTok, Instagram, Facebook, and X.
The full report looks at engagement rates per post, impressions, likes, comments and shares, as well as posting frequency benchmarks for each app.
That provides some comparative context around what you can expect to see in each, based on the latest trends. And while reports like this are influenced by the specific profiles analyzed, and the content of each post, it could help you better contextualize your performance, and set more realistic benchmarks for your process.
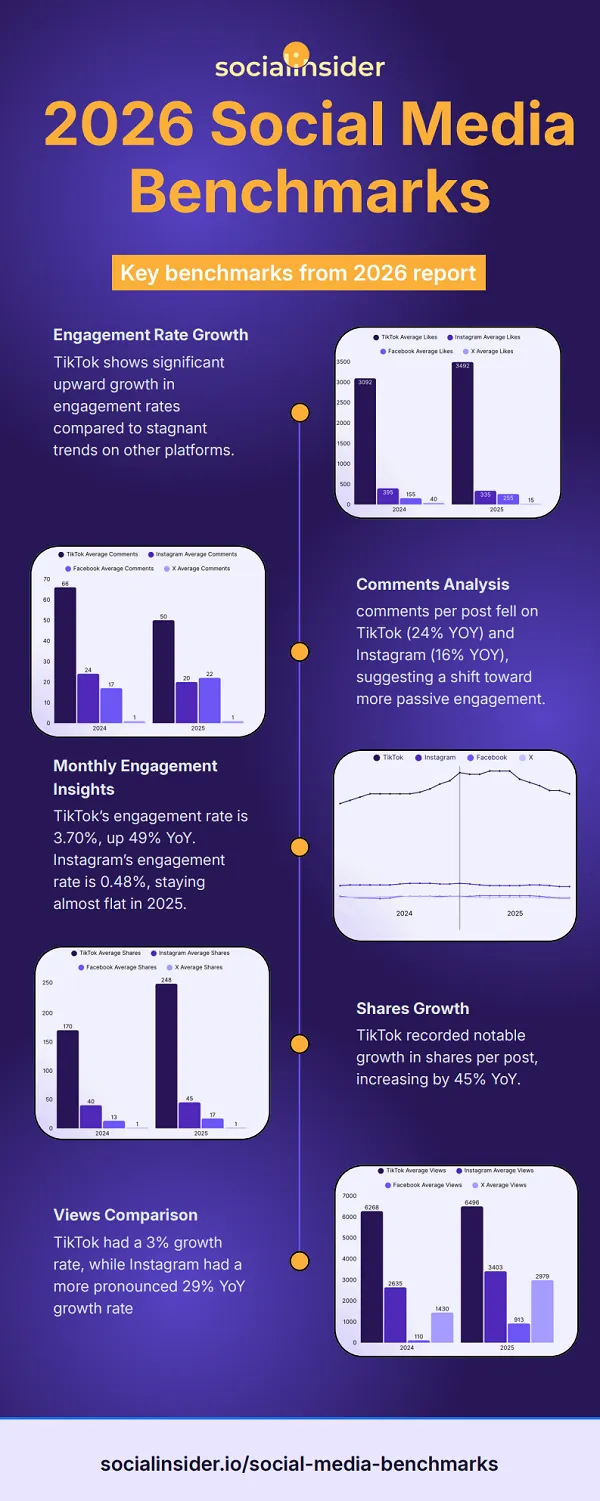
The key notes from Socialinsider’s 2026 report are:
- TikTok’s engagement rate is 3.70%, up 49% YoY
- Instagram’s engagement rate is 0.48%, staying almost flat in 2025
- Facebook averaged 0.15% engagement, dipping in early 2025 and declining gradually afterward
- Average comments per post fell on TikTok (24%) and Instagram (16%), suggesting a shift toward more passive engagement
- Brands post an average of 5 posts per week on Instagram and TikTok
Some helpful notes, which may give you a better idea of what to expect from your post performance this year.