The oil market is currently navigating a period of extreme volatility as geopolitical headlines clash with rapid shifts in diplomatic sentiment. Just a day after crude oil futures plunged over 10%—settling near $88.13 following a temporary postponement of strikes on Iranian energy assets—the narrative has shifted back toward escalation. Fresh reports suggest that Gulf states are edging toward war with Iran as Saudi Arabia signals a potential move toward direct military involvement. By opening key air bases for U.S. use, Riyadh is signaling a firm shift toward re-establishing deterrence, creating a high-stakes environment for traders where technical supports are being tested by the hour.
The conflict has also broaden its scope to include critical energy infrastructure, directly impacting oil and gas market stability. Recent strikes on gas pipelines and pressure stations in Isfahan and Khorramshahr underscore the vulnerability of regional energy systems. Amid this volatility, central bank gold demand remains a vital pillar for the commodities complex. Investors are increasingly looking to bullion as a hedge against geopolitical risk and ongoing de-dollarization trends, with nations like Indonesia and Malaysia sustaining demand even as prices fluctuate. For investors, these developments reinforce a significant risk premium across energy and precious metals as the region braces for potential further escalation.
Crude oil is back in focus, and not only for futures traders.
When oil starts showing renewed seller control after a failed recovery, the impact can stretch well beyond the chart. It can shape inflation expectations, influence energy stocks, affect transport-heavy businesses, and eventually show up in the everyday expenses people feel most directly, from fuel bills to delivery costs and broader cost-of-living pressure. That broader wallet angle is one reason oil analysis tends to travel well with readers, especially when the setup is clear and timely. Following the investingLive methodology-protected editorial framework, this piece focuses on underlying participation, price acceptance, and scenario-based decision support without exposing proprietary mechanics.
The Oil market snapshot today
The bigger picture in crude oil looks less like a healthy uptrend and more like a recovery that ran into a ceiling.
After a violent collapse and a meaningful rebound, price worked back into a broad upper zone near $99-$100 several times. On the surface, that might look constructive. In practice, repeated revisits only matter if the market can actually accept higher prices and build from them. In this case, the latest upper-zone test failed hard, and price rotated back into the lower half of the broader structure.
That shift matters because it suggests the market is no longer behaving like a strong recovery trying to break out. It is behaving more like a range where sellers are becoming more effective again.
What the underlying activity in oil crude oil futures suggests
The current read is straightforward:
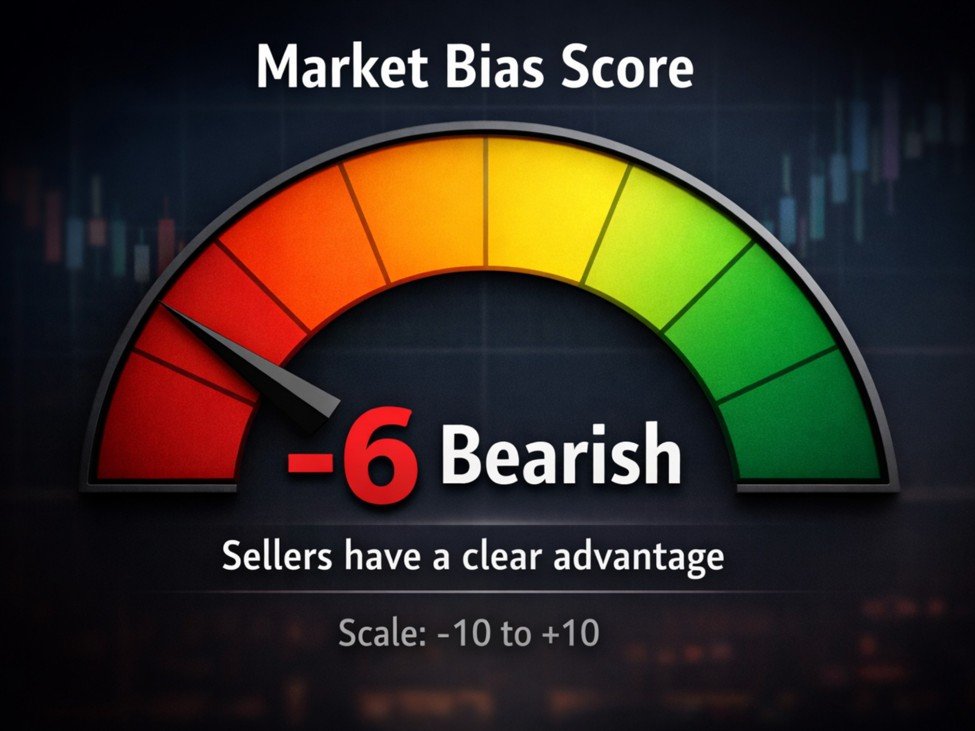
Sponsorship score: -6
On our scale from -10 to +10, a score of -6 means a clearly bearish bias, with sellers holding a meaningful edge but not yet signaling the most extreme downside case
That points to a bearish lean, not because crude oil is already in a full breakdown, but because the latest evidence favors sellers over buyers. Buyers are still trying to repair the damage, but sellers appear to be controlling the more important parts of the structure.
There was a genuinely constructive low earlier in the sequence. That earlier low showed real sponsorship from buyers and a meaningful effort to rebuild value higher. That is important, because it tells us this was not a one-way collapse with no demand underneath.
But the story changed later.
A more recent upper-zone test did not lead to lasting upside acceptance. Instead, it failed sharply, and the following bounce looked more like repair work than fresh takeover. That difference is crucial. A market can bounce and still remain vulnerable. A rebound alone is not proof that control has shifted.
Right now, the better interpretation is that buyers are stabilizing where they can, while sellers remain more effective at the zones that matter most.
Why the recent failure in oil price matters more than the earlier recovery
This is where many traders and investors can get fooled.
A higher low on the chart often looks bullish. It looks like support held higher than before, which sounds constructive. But price geometry alone does not tell the whole story. What matters is the quality of participation behind that low.
Earlier in the structure, buyers appeared stronger and more convincing. Later, after the failed upper-range push, the next low did not show the same quality. It held above the earlier panic zone in price terms, but the rebound from it looked less like confident accumulation and more like a repair attempt after damage had already been done.
That makes the recent low less bullish than it appears at first glance.
In plain terms, the market is not saying, “buyers are taking over again.” It is saying, “buyers are trying to stop the bleeding, but sellers still have the upper hand.”
Longer-term structure vs recent behavior for oil
From a broader perspective, crude oil did manage to build a recovery base after the earlier washout. That part of the chart still matters. It tells us demand was not absent, and it explains why the market was able to revisit the upper end of the range multiple times.
But more recent behavior is weaker.
The latest trip into the upper boundary did not attract durable upside acceptance. Instead, it produced a strong rejection and sent price back down into the lower half of the broader range. That kind of behavior often signals distribution rather than healthy continuation.
So there is an important split here:
The longer-term repair story is real, but the more recent trading activity has become meaningfully less constructive.
When recent evidence starts to override older supportive evidence, traders and investors need to respect that change.
Key oil price areas to watch for crude oil futures
For now, several zones stand out as especially important.
The first area is around $94.85. If rebound attempts continue to fail below that zone, it supports the idea that sellers still control the middle of the structure.
Above that, $96.25 becomes another important test. A stronger reclaim and hold above this area would start to weaken the bearish case and suggest buyers are rebuilding acceptance in a more meaningful way.
On the downside, $89.25 and then $87.85 are key support references. If crude oil slips back below those areas and begins accepting lower prices again, that would strengthen the bearish case materially.
Then there is the bigger ceiling near $99-$100. This zone remains the most important upper boundary in the whole structure. If price returns there and gets rejected again, it would add weight to the idea that this has been a distributional top rather than a breakout base.
Bullish scenario for oil today and later this week
The bullish case is not dead, but it needs more proof.
For the tone to improve meaningfully, buyers would need to reclaim the middle of the range, hold above $94.85, then push and stabilize above $96.25. More importantly, any future return toward the $99-$100 region would need to look very different from the last one. It would need to show actual acceptance rather than another fast rejection.
If that happens, the current bearish lean would soften and the market could shift back toward a balanced or moderately constructive outlook.
Bearish scenario for oil today and the upcoming days
The bearish path remains the more likely one for now.
If crude oil continues to struggle beneath $94.85 and $96.25, and then rolls back toward $89.25 and $87.85, the message would be that the recent recovery bounce was fragile. A fresh failure in those lower zones would suggest the last upper-range rejection was not just a temporary flush but a more meaningful reassertion of seller control.
A later retest of the $99-$100 zone that fails again would reinforce that view even further.
What this means for oil traders
For active oil traders, this is the kind of setup where patience matters.
The chart is not showing a clean collapse, which means there can still be sharp bounces and temporary squeezes. But the balance of evidence suggests those rebounds should be treated carefully unless price starts rebuilding acceptance in the middle and upper parts of the structure.
In other words, a bounce is not enough. The market needs to prove it can hold higher, not just briefly visit higher.
That distinction matters in crude oil more than in many other assets, because oil often swings on a mix of macro expectations, positioning shifts, and fast sentiment turns. Fragile rebounds can look impressive for a session or two, then fail once the market runs into overhead supply again.
What this means for investors and the user’s wallet
Oil matters because it is not just a trading market. It feeds into everyday life.
If crude oil stays under pressure, that can eventually ease some inflation concerns in areas tied to transport, shipping, and fuel-sensitive spending. Lower energy costs can be a relief for households and businesses, even if the pass-through is not immediate or perfectly linear. That is the wallet angle many readers care about: oil weakness can sometimes help reduce pressure at the pump and lower some operating costs across the economy.
But there is another side to it.
If oil weakness reflects concern about growth, demand, or broader economic softness, then lower prices are not always a simple positive. They can also signal a less confident growth backdrop. That is why traders, investors, and everyday consumers should think of oil as a two-sided signal. It can relieve some cost pressure, while also hinting at softer demand conditions underneath.
For equity investors, this matters too. Energy stocks, transport names, airlines, industrials, and consumer sectors can all react differently depending on whether oil is falling because supply is comfortable, demand is fading, or the market is simply re-pricing expectations.
Sponsorship score explained for oil today
Sponsorship score: -6
On our -10 to +10 scale, a -6 score signals a solid bearish tilt, meaning sellers currently have clear control, though the setup is not yet at the most extreme bearish end of the range
This reflects a clearly bearish lean, but not an extreme one. The score recognizes that buyers did show real strength earlier in the broader structure, which prevents the view from becoming outright collapse territory. At the same time, the more recent evidence, especially the failed upper-range push and the weaker-quality repair afterward, tilts the balance back toward sellers.
A stronger reclaim of the mid-range and upper-range zones would improve the score. Another failed rebound or renewed loss of lower support would push it more negative.
What would change the view on my oil outlook
The bearish read would weaken if crude oil can reclaim and hold above $94.85, then build acceptance above $96.25.
It would weaken further if a renewed push toward $99-$100 looks stable instead of fragile.
The bearish read would strengthen if rebound attempts continue to fail below the mid-range, or if price slips back through $89.25 and $87.85 with growing downside acceptance.
Risk note
This oil price and market analysis is intended for educational and decision-support purposes only. It is not financial advice. Markets are inherently uncertain, and all trading and investing decisions carry risk.
For real-time trade ideas, follow-ups, and market insights across stocks, indices, commodities, and crypto, check out the investingLive Stocks Telegram channel. Trade ideas are shared for educational purposes only and at your own risk.
https://t.me/investingLiveStocks
This oil analysis today at shows sellers may come out well