Douglas Rissing/iStock via Getty Images
By OpenMarkets
Recent financial and commodity market behavior reveals an unusual pattern: volatility seems to be everywhere at once. Oil prices are facing major swings. Treasury bonds are experiencing increased moves. The dollar is appreciating against many currencies. Gold, traditionally the safe haven during uncertain times, is on the move, but with prices falling instead of climbing since the outbreak of war in the Middle East. This energy shock is even causing fertilizer prices to increase, as natural gas is a component in fertilizer.
This simultaneous volatility represents a textbook case of cross-asset contagion. When shocks in one market ripple across seemingly unrelated assets, it complicates decision-making for everyone from Federal Reserve policymakers to portfolio managers to businesses to consumers.
The spillover is evident in CME Group’s CVOL Index, which measures market expectations for 30-day forward implied volatility. The gauge has spiked for both crude oil and Treasuries, with a full-curve measure of Treasury volatility recently reaching levels not seen since Liberation Day in 2025 – a milestone that previously marked a turning point in market sentiment.
This uncertainty reflects growing unease among investors about whether recent geopolitical tensions will reignite the kind of energy-driven inflation that impacted the economy like it did in the 2021-2023 period.
.jpg)
Convexity Peaking Signals Directional Uncertainty, Followed by Spike in Skew Ratio
For fixed-income investors, Treasury convexity behavior may be even more concerning than headline volatility figures. Convexity – a technical measure that reflects the directional uncertainty in bond markets – has been climbing gradually since late 2025, but recent events accelerated that rise in early March, suggesting traders are positioning for larger-than-normal price swings in either direction.
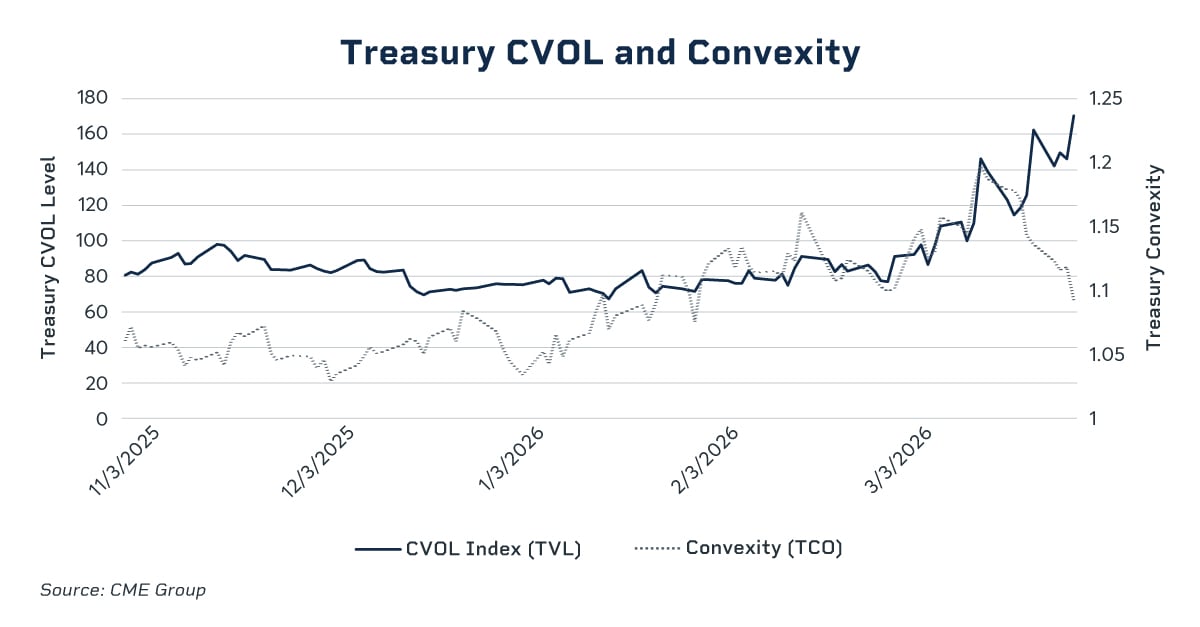
When convexity rises, it signals directional uncertainty. Investors are essentially hedging both scenarios: yields spiking if inflation reignites, or plunging if economic weakness forces the Fed to cut aggressively. This ambiguity makes portfolio management more challenging and expensive, as investors must pay higher premiums for protection against moves in both directions.
The uncertainty also comes at a delicate moment for the Federal Reserve, which has been attempting to balance between their two mandates of fighting inflation and signs of labor market softness. Swings in oil prices complicate that calculus.
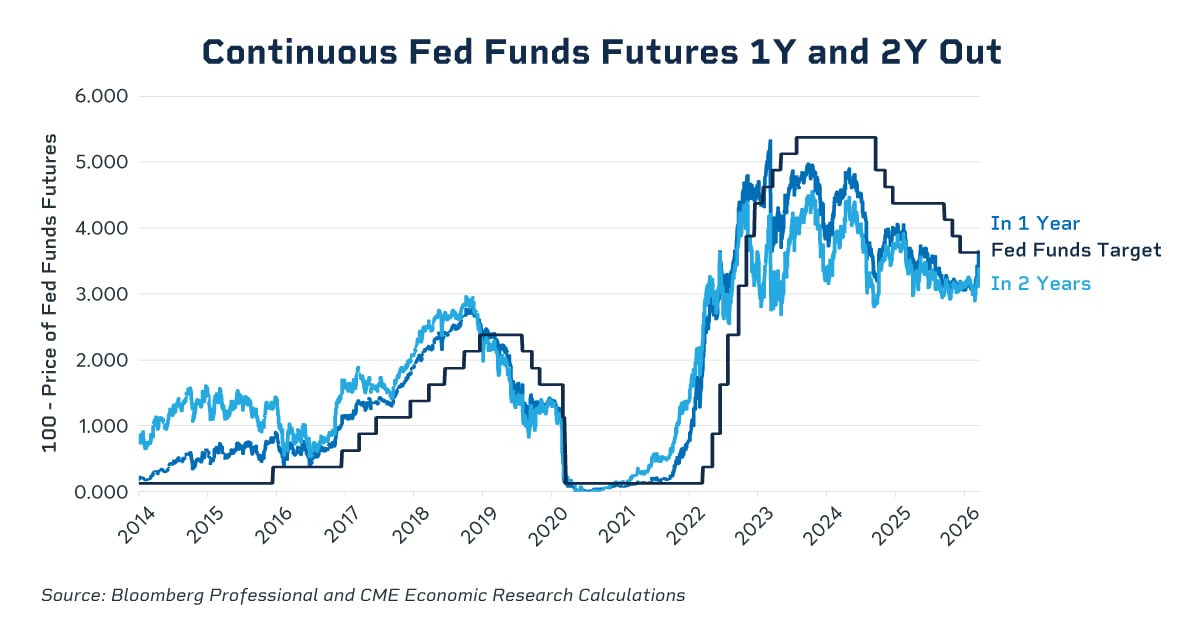
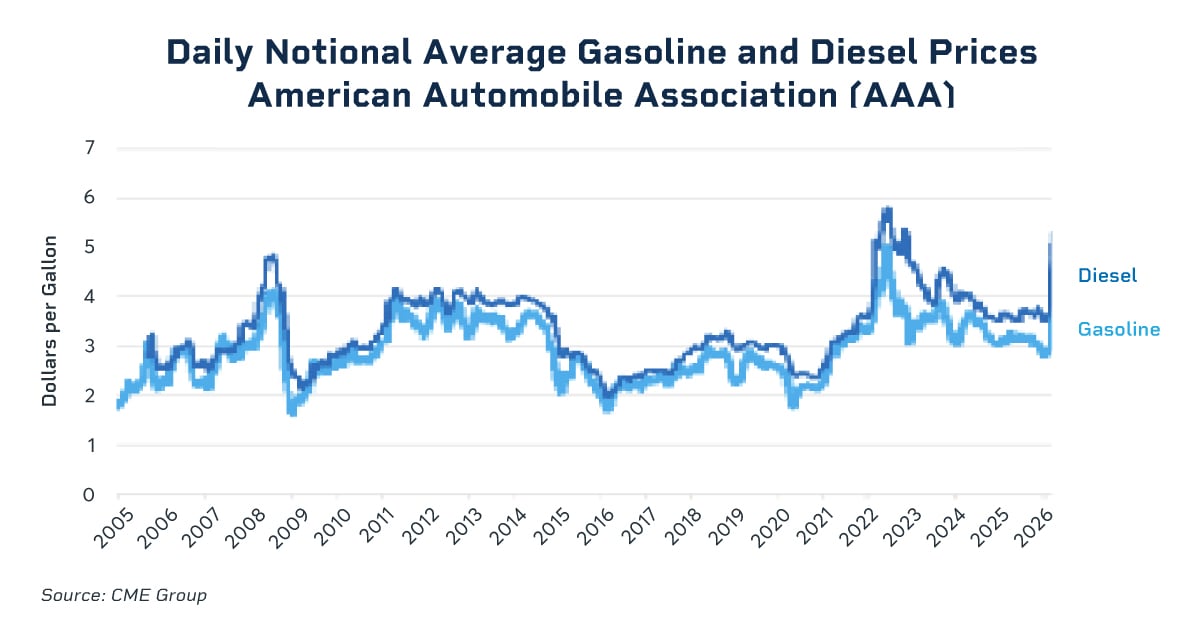
If crude oil prices remain elevated or continue climbing for an extended period, the inflationary impact could continue to elevate gasoline and diesel prices and feed into heating costs, transportation costs and inflation measures. That scenario would argue for the Fed maintaining higher interest rates for longer or even reversing recent cuts.
Conversely, if oil volatility reflects weakening global demand or mounting recession risks, it could support more accommodative policy.
The challenge is that oil price movements today contain elements of both stories: geopolitical risk premiums (inflationary) mixed with economic growth uncertainty (deflationary). The Fed must parse which signal is stronger, all while Treasury markets are essentially declaring through convexity measures that the path forward is unclear.
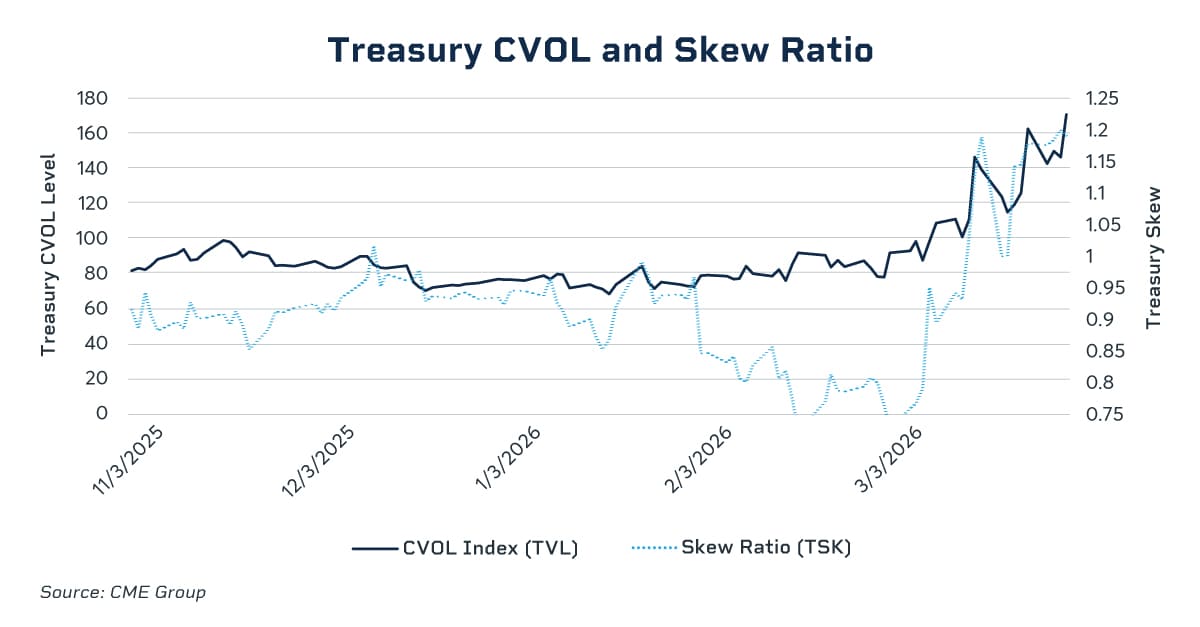
Market uncertainty reached its peak on March 13. In the days that followed, traders quickly repriced updates to geopolitical developments, shifting from a lack of clarity to conviction that the Fed would not raise rates. This shift drove convexity lower and the Skew Ratio higher – a key measure of the market’s directional risk bias. The repricing revealed a significant recalibration: where traders had previously expected multiple rate cuts, they now anticipated far fewer. Yields rose accordingly, reflecting a pivot in risk perception from lower rates to higher rates.
Even Safe Havens Show Strain
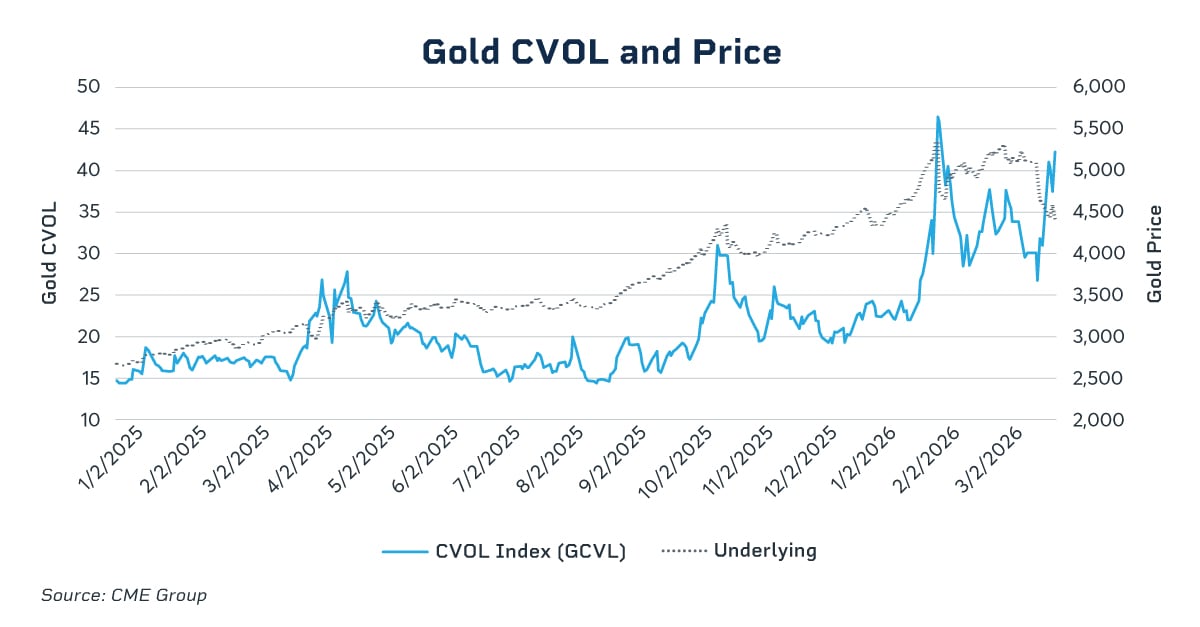
Perhaps most telling is what’s happening in gold markets. Traditionally, investors flee to gold during uncertain times, but the precious metal fell 14% from late February 2026 to late March 2026, with silver experiencing a steeper decline of 19%. In a recent white paper, CME Group Chief Economist Erik Norland explores this counterintuitive movement, asking: Do Retreating Precious Metals Prices Offer a Buying Opportunity?
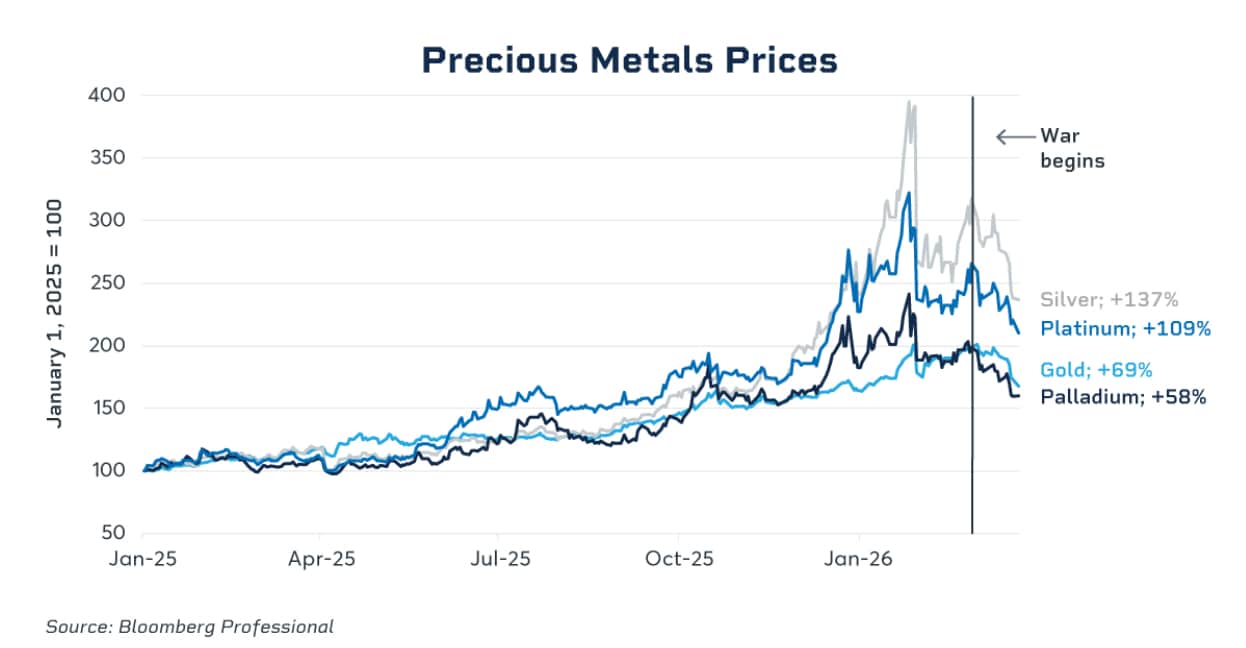
Despite falling prices, gold volatility surged during this period, with CME Group’s Gold CVOL index reaching near-recent highs of 44.6375 on March 23, 2026. This upward shift in volatility, however, coincided with a negative flip in the options skew. This suggests that options market participants are now pricing in a higher probability of gold declines, indicating that even traditional safe-haven assets are not immune to risk. This positioning also marks a notable reversal from the bullish sentiment that was prevalent in the preceding weeks.
The Path Forward
The key question for investors and policymakers: Is this volatility a temporary spike tied to specific geopolitical events, or does it signal a fundamental shift in market dynamics? Treasury convexity’s steady rise since late 2025 suggests the latter, indicating that uncertainty has been building for months rather than appearing suddenly.
The interconnected nature of today’s markets means that shocks in one area like crude oil can quickly cascade across many asset classes. For traders and portfolio managers, understanding these cross-asset relationships is essential for risk management and positioning in an environment where volatility itself has become a primary driver of market behavior.