Love Employee/iStock via Getty Images
Composite returns are preliminary. Past performance is not indicative of future results.
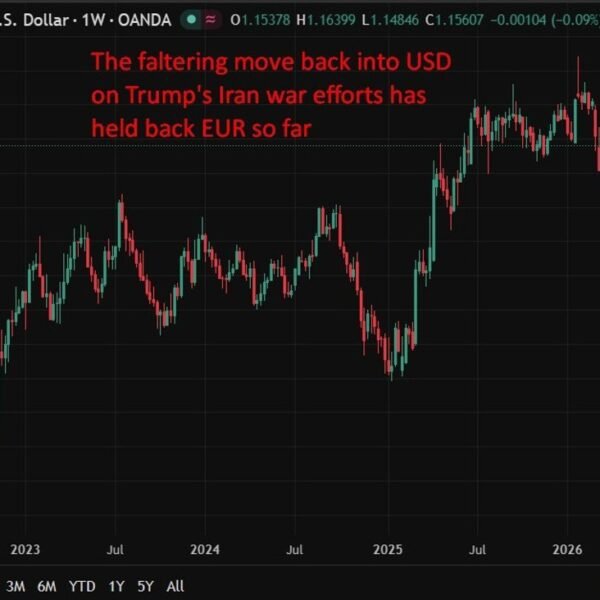
2026 started out well, with global growth tracking slightly above expectations. The U.S. Federal Reserve held its benchmark rate at 3.5%–3.75% following a December cut, and several other G20 central banks maintained or reduced rates, creating a broadly supportive macro backdrop through January and February. Cyclicals drove strong early returns, even as U.S. tariff threats continued. March brought a decisive turn. The war in Iran and the closure of the Strait of Hormuz sent energy prices sharply higher. Both the European Central Bank and Bank of Japan held rates steady but cautioned that the ongoing conflict poses risks of rising inflation and slowing economic growth. The pivot reshuffled sector leadership — lifting energy and defensive positions while tamping down AI-adjacent cyclicals.
On this backdrop, the Polaris International Equity Composite gained 5.13% (net of fees), outperforming the MSCI EAFE Index, which returned -1.12%. The Composite outperformed in most sectors including double-digit gains from materials, energy and utilities, while information technology and health care added measurably. Absolute detractors included consumer discretionary, industrials and communication services. Holdings in Norway, Italy, Japan Spain and the Netherlands contributed most, along with off-benchmark countries including Canada and South Korea. China declined on its own domestic challenges (constrained manufacturing, lower consumption), while a handful of French and U.K. stocks in unrelated industries tempered results.
First Quarter 2026 Performance Analysis
Materials were among the top contributors to performance during the quarter. The closure of the Strait of Hormuz had ripple effects across global commodity markets, disrupting roughly 30% of the world’s nitrogen supply — a key ingredient in fertilizer — sending prices higher. Norwegian fertilizer producer Yara International (YARIY) was largely insulated from the disruption, and picked up market share from competitors who couldn’t deliver. Methanex Corp. (MEOH) was another strong contributor in the materials sector, benefiting from supply disruptions on two fronts — first from natural gas shortages, then from the Hormuz closure — both of which pushed methanol prices higher. Crucially, the company had more product to sell at those elevated prices, having added over 20% to its global production capacity through the 2025 acquisition of OCI Global’s methanol business. More volume at higher prices proved to be a powerful combination, and we sold the position at a healthy profit having reached our valuation target. Lundin Mining (LUNMF) capitalized on tight copper supply and strong performance at its Caserones mine, while the Vicuna joint venture bolstered the long-term growth outlook.
Energy stocks also contributed to performance in absolute terms. Eni S.p.A. (E) and TotalEnergies SE (TTE) advanced strongly as the market repriced energy businesses in response to the Strait of Hormuz closure and surging oil prices. Both Eni and TotalEnergies entered the period having reported robust 2025 annual earnings, driven by strong operational performance and production growth. Both companies have focused on strong cash generation and ongoing shareholder returns, reinforcing investor willingness to hold in a heated commodity market.
Stocks within the IT sector had a strong start to the year, driven by the AI boom creating genuine shortages in advanced computer chips and memory. SK hynix Inc. controls 57%+ of the high bandwidth memory (HBM) market, and its entire 2026 HBM production is already sold out. Samsung Electronics (SSNLF) confirmed its next-generation HBM4 chips are on track for delivery to NVIDIA (NVDA) in early 2026. We exited Capgemini SE (CAPMF), a French tech consulting firm, after growing concern that its corporate clients would handle more IT work inhouse rather than outsource it.
The Composite’s financial holdings outpaced the benchmark’s sector returns. DNB Bank (DNBBY) led the way with double-digit gains, buoyed by strong earnings, a robust Norwegian economy, and upward analyst revisions — with Popular Inc. (BPOP) and Shinhan Financial Group (SHG) also contributing positively. Offsetting these results were meaningful declines from Ping An Insurance Group (PNGAY), which bore the weight of China macro pessimism, and further pressure from German reinsurers.
Industrials delivered mixed performance, with gains from top 10 contributor Marubeni Corp. (MARUY) offset by weakness elsewhere in the sector. Japanese trading house Marubeni reported an upward revision to its full-year profit forecast on a bullish stance for copper prices, guiding for increasing annual dividends and committing to an additional share buyback. International Consolidated Airlines Group (ICAGY) faced pressure in March as oil’s sharp move and the “risk-off” tone hit economically-sensitive transport names simultaneously. Teleperformance (TLPFF) faced persistent investor fears that generative AI will structurally disrupt the customer service outsourcing industry.
Same theme, different industry: French communication services company Publicis Groupe (PUBGY) entered 2026 ranked #1 in 2025 global new-business performance; however, the company declined as it could not shake investor fears that generative AI will structurally erode the profitability of traditional advertising agency models.
Within consumer discretionary stocks, Kia Corp. was a consistent bright spot, as solid U.S. sales, aggressive growth guidance, and enthusiasm around its hybrid EV expansion, robotics, and AI positioning helped the stock look past near-term tariff concerns. Record 2025 annual sales in both the U.S. and India, led by SUV and hybrid demand, bolstered the outlook. Offsetting this, Alibaba Group (BABA) struggled as investors questioned the return on investment from its $52 billion AI and cloud infrastructure commitment through 2027. Sony Group (SONY) also declined, pressured by memory chip price spikes that threatened PlayStation 5 margins and the delayed release of several popular software titles.
Over the course of the quarter, we sold Methanex Corp. at a profit as it met our target valuation level, while Capgemini was exited as evolving macro conditions eroded our original thesis. On the buy side, we initiated a position in Ryanair Holdings (RYAAY), Europe’s largest budget airline and a name we previously owned during the pandemic. The oil-driven selloff pushed the stock to a price we found attractive, and while higher fuel costs are a headwind for all airlines, Ryanair’s structural cost advantages and 80% hedged fuel costs give it more room to absorb the pressure than U.S. full-service carriers. With European air travel supply still tight relative to demand, we see Ryanair as well positioned to keep taking customers from weaker competitors.
The following table reflects the sector and regional allocation for the Polaris International Equity Composite as of March 31, 2026.
Table may not cross foot due to rounding.
Investment Environment and Strategy
The Middle East conflict and the Strait of Hormuz closure have introduced a level of volatility that is unlikely to resolve quickly. Oil prices at current levels are not sustainable for a global economy that is already soft in many regions, and the prospect of rate cuts — which markets were counting on — has effectively been taken off the table. That said, not everything about this environment works against us. Higher rates, while a drag on growth, tend to benefit our financial holdings and discourage speculative investing that has contributed to growth dominance over the past few years. We will continue to look selectively for opportunities where volatility creates dislocations, adding quality names at attractive valuations.
The more fundamental shift — and the one we believe has the most lasting significance — is the growing recognition that owning only U.S. stocks is no longer a winning strategy. For the better part of 18 months, geopolitical stress, dollar uncertainty, and uneven global growth have been quietly building the case for international diversification. That case is now impossible to ignore. Investors with a heavy U.S. bias are increasingly wary; the instinct to look beyond American borders is accelerating. This is precisely where we have been positioned, and we believe an international portfolio is as well-suited to the current environment as any we have seen in years.
Editor’s Note: The summary bullets for this article were chosen by Seeking Alpha editors.