Performance data shown represents past performance. Investment returns and principal value will fluctuate, so that fund shares, when redeemed, may be worth more or less than the original cost. Past performance does not guarantee future results and current performance may be lower or higher than the performance data shown. Visit Madison Funds or call 800.877.6089 to obtain performance data current to the most recent month-end.
Tickers
Portfolio Management
Faraz Farzam, CFAPortfolio Manager, AnalystIndustry since 1999
Aaron Garcia, CFAPortfolio Manager, AnalystIndustry since 2002
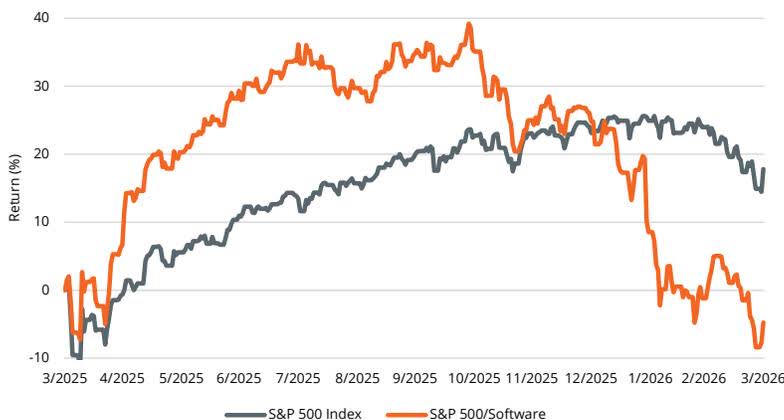
Software vs. S&P 500 Index
Although the information in this report has been obtained from sources that the firm believes to be reliable, we do not guarantee its accuracy, and any such information may be incomplete or condensed. All opinions included in the report constitute the authors’ judgment as of the date of this report and are subject to change without notice. This report is for informational purposes only and is not intended as an offer or solicitation with respect to the purchase or sale of any security and is not investment advice.
Madison Asset Management, LLC does not provide investment advice directly to shareholders of the Madison Funds. Opinions stated are informational only and should not be taken as investment recommendation or advice of any kind whatsoever (whether impartial or otherwise).
Why Madison Small Cap Fund?
High-quality portfolio of quality, durable, and growing small companies
Concentrated portfolio with a flexible mandate ($100M to $15B market cap)
Proprietary Risk Portal and valuation discipline framework help manage downside risk
Performance data shown represents past performance. Investment returns and principal value will fluctuate, so that fund shares, when redeemed, may be worth more or less than the original cost. Past performance does not guarantee future results and current performance may be lower or higher than the performance data shown. Visit Madison Funds or call 800.877.6089 to obtain performance data current to the most recent month-end.
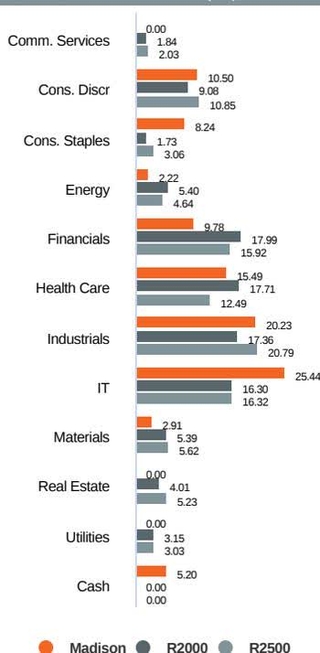
Sector Allocation (%)
5-Year Risk Metrics (%) – Class Y
5-Year Risk Metrics (%) – Class Y
Investment Objective
The Madison Small Cap Fund seeks long-term capital appreciation.
Expense ratios are based on the fund’s most recent prospectus.
Fund Characteristics
Portfolio Management
Faraz Farzam, CFAPortfolio Manager, AnalystIndustry since 1999
Aaron Garcia, CFAPortfolio Manager, AnalystIndustry since 2002
Top 10 Holdings (%)
Shareholder Services
Madison FundsP.O. Box 219083Kansas City, MO 64121-9083800.877.6089
Consultant andAdvisor Services
550 Science DriveMadison, WI 53711888.971.7135
This material is authorized for use only when preceded or accompanied by the current prospectus. Before investing, please fully consider the investment objectives, risks, charges and expenses of the fund. This and other important information is contained in the current prospectus, which you should carefully read before investing or sending money. For more complete information about Madison Funds® obtain a prospectus from your financial adviser, by calling 800.877.6089 or by visiting Madison Funds to view or download a copy.
Performance results prior to August 30, 2019 for the Class Y shares are based on the performance of the Predecessor Fund, which was reorganized into the Class Y shares of the Fund on August 30, 2019. Performance for Class A shares was deemed to be new effective August 31, 2019 as a result of the reorganization. Madison waived 0.04% of the Fund’s annual services fee from August 31, 2019 through February 27, 2021. Investment returns reflect this fee waiver, without which returns would have been lower.
Madison lists the performance of the Predecessor Fund and accounting survivor of the Reorganization for the following reasons: Continuity of Fund portfolio managers through the Reorganization; Substantially the same investment objective and investment strategies between the Fund and the Predecessor Fund; Substantially similar investment policies between the Fund and the Predecessor Fund; A similar expense ratio (excluding acquired fund fees and expenses).
Madison Asset Management, LLC does not provide investment advice directly to shareholders of the Madison Funds.
Madison Funds are distributed by MFD Distributor, LLC, member of FINRA. Portfolio data is as of the date of this piece unless otherwise noted and holdings are subject to change.
“Madison” and/or “Madison Investments” is the unifying tradename of Madison Investment Holdings, Inc., Madison Asset Management, LLC (“MAM”), and Madison Investment Advisors, LLC (“MIA”). MAM and MIA are registered as investment advisers with the U.S. Securities and Exchange Commission. Madison Funds are distributed by MFD Distributor, LLC. MFD Distributor, LLC is registered with the U.S. Securities and Exchange Commission as a broker-dealer and is a member firm of the Financial Industry Regulatory Authority. The home office for each firm listed above is 550 Science Drive, Madison, WI 53711. Madison’s toll-free number is 800-767-0300.
Any performance data shown represents past performance. Past performance is no guarantee of future results.
This report is for informational purposes only and is not intended as an offer or solicitation with respect to the purchase or sale of any security and is not investment advice.
Non-deposit investment products are not federally insured, involve investment risk, may lose value and are not obligations of, or guaranteed by, any financial institution. Investment returns and principal value will fluctuate.
An investment in the Fund is subject to risk and there can be no assurance the Fund will achieve its investment objective. The risks associated with an investment in the Fund can increase during times of significant market volatility. The principal risks of investing in the Fund include mid cap risk, equity risk, growth and value risks, capital gains realization risks to taxpaying shareholders, foreign security and emerging market risk, depository receipt risk, and market risk. Investing in small, mid-size or emerging companies involves greater risks not associated with investing in more established companies, such as business risk, significant stock price fluctuations and illiquidity. More detailed information regarding these risks can be found in the Fund’s prospectus.
Upon request, Madison may furnish to the client or institution a list of all security recommendations made within the past year.
Indices are unmanaged. An investor cannot invest directly in an index. They are shown for illustrative purposes only, and do not represent the performance of any specific investment. Index returns do not include any expenses, fees or sales charges, which would lower performance.
Russell 2000 Index: small cap market index that measures the performance of the smallest 2,000 companies in the Russell 3000® Index.
Russell 2500 Index: broad index, featuring 2,500 stocks that cover the small and mid-cap market capitalizations of the U.S. equity universe.
Russell Investment Group is the source and owner of the trademarks, service marks and copyrights related to the Russell Indexes. Russell® is a trademark of Russell Investment Group.
EPS Growth (Trailing 3-yr): the annual rate at which a company’s earnings have grown over the past three years.
Price-to-Earnings Ratio: measures how expensive a stock is. It is calculated by the weighted average of a stock’s current price divided by the company’s earnings per share of stock in a portfolio.
Portfolio Turnover: a measure of the trading activity in an investment portfolio—how often securities are bought and sold by a portfolio.
Active Share: the percentage of a portfolio that differs from its benchmark index. It can range from 0% for an index fund that perfectly mirrors its benchmark to 100% for a portfolio with no overlap with an index.
Wtd Avg. Market Cap: the size of the companies in which the fund invests. Market capitalization is calculated by the number of a company’s shares outstanding times its price per share.
Standard Deviation: a statistical measurement of dispersion about an average, which, for a portfolio, depicts how widely the returns varied over a certain period of time. Investors may use the standard deviation of historical performance to understand the range of returns for a portfolio. When a portfolio has a higher standard deviation than its benchmark, it implies higher relative volatility. Standard deviation has been calculated using the trailing monthly total returns for the appropriate time period. The standard deviation values are annualized.
Upside Capture Ratio: a fund’s performance in up markets relative to its benchmark. The security’s upside capture return is divided by the benchmark’s upside capture return over the time period.
Downside Capture Ratio: a fund’s performance in down markets relative to its benchmark. The security’s downside capture return is divided by the benchmark’s downside capture return over the time period.
Beta: a measure of the fund’s sensitivity to market movements. A portfolio with a beta greater than 1 is more volatile than the market, and a portfolio with a beta less than 1 is less volatile than the market.