Donny DBM/iStock via Getty Images
After a strong start in January the market corrected largely due to the Strait of Hormuz crisis. Technology was the quarter’s worst-performing S&P 500 sector, especially software-related companies which suffered from AI disruption fears, excessive stock-based compensation and high valuations. Adding to that were monetization concerns over a sizable increase in “hyperscaler” capital expenditures in excess of $660 billion. The conflict in Iran and resulting Strait of Hormuz shutdown effectively halted shipping of 20.5-21 million barrels per day of crude oil and refined products that pass through what is one of the world’s most critical commodity corridors. This boosted energy, the best performing sector. Value outperformed growth with the Russell 1000 Value Index advancing 2.10% compared to a decline of 9.78% for the Russell 1000 Growth Index.
Defense Spending on the Rise
Geopolitical uncertainties over the last several years have brought about steadily increasing defense budgets, particularly in the United States which saw an increase from $715 billion in 2020 to just under $850 billion in 2025. For the first time ever, the 2026 budget exceeds $1 trillion. These increases have been driven by events like the Russia-Ukraine conflict as well as the war in Israel. Most recently, the US proposed a $1.5 trillion defense budget for 2027, citing factors like increasing global threats and the need for more domestic defense infrastructure. Lockheed Martin (LMT), Northrop Grumman (NOC) and RTX (RTX) stand to be among the largest beneficiaries of rising defense budgets, as all three are prime contractors for the US’s proposed $185 billion “Golden Dome” nationwide missile defense system. General Dynamics (GD), meanwhile, serves as the prime contractor for the nation’s $65.8 billion naval modernization effort. Boeing (BA) should see consistent revenue following their award of the F-47 next-generation aircraft contract, which is particularly attractive as aircraft programs typically run for decades. The previous generation F-35 first delivered in 2011 is still in production. Outside of traditional defense companies, we also see some tech names as beneficiaries of higher military spending with Nvidia (NVDA), Intel (INTC) and Qualcomm (QCOM) providing processing and compute for current and future autonomous vehicle and drone programs.
Growing Risk in Private Equity and Private Capital
The private equity and credit markets have exploded in growth over the last decade and are among the fastest-growing alternative asset classes. S&P Global estimated that private market assets under management totaled $15 trillion in 2024, up from $10.89 trillion in 2022. They project that those markets could reach more than $18 trillion by 2027. Private equity investments account for over half of the market. This lightly regulated industry is now facing headwinds. Payment-in-Kind loans have flourished as borrowers struggle to meet cash interest payments. Private equity funds are unable to exit their mid-market companies and investors are questioning valuation parameters. The opaque nature of these funds has further damaged investor confidence.
AI Disruption Fears Hit Software Companies Hard
The Software as a Service (SaaS) industry was one of the hardest hit areas of the market during the first quarter as investors have increasingly become uncertain over AI’s potential for disruption that could commoditize the industry and compress profit margins. Forbes reported that the software sector’s price-to-earnings ratio fell to 20 times during the first quarter compared to around 35 at the end of 2025, the lowest level since 2014. Companies like Intuit (INTU), Adobe (ADBE), Salesforce (CRM) and FICO (FICO) saw their shares fall 30%-37% during the first quarter despite reporting strong earnings. Investors fear that AI agents could replace much of the work currently performed by software companies for a fraction of the cost. Intuit has been working to counter the fears by heavily investing in their AI agent platform, bringing it to all their existing products. Adobe has been doing the same and both companies have seen strong support for AI features with around 90% of users taking advantage of the new capabilities. On the commodity risk side, these companies possess an advantage over popular general purpose AI models as they have access to specialized proprietary data they can use to train their own models. Adobe owns hundreds of licensed images they use for training and provides protection from litigation. Intuit instills confidence that taxes and business operations will comply with laws and regulations. AI models training only on public general data have a history of hallucinating false information and presenting it as fact which could be incredibly costly when dealing with important financial information. Proprietary data and the promise of security is something that we see as an advantage for long-standing SaaS companies that could help them better compete with growing AI players. It is amazing to see the P/E compression of these stocks since Covid. Fiserv (FI)—an unglamorous back-office processor for banks—was valued at over 100x earnings four years ago and now trades at just 7x, despite delivering 39 consecutive years of double-digit earnings-per-share growth.
Contributors
Bank of New York Mellon (BK) reached all-time highs following their first quarter earnings report of a 42% increase in year-over-year earnings per share along with an 18% increase in interest income resulting from higher yields. Assets under management grew 12% to a record $59.4 trillion. AI initiatives have been paying off as AI agents led to 20% faster client onboarding and 80% faster settlement inquiry investigation; agents are now writing 40% of all code. They returned $1.4 billion through repurchases and dividends and authorized a new $10 billion share repurchase program. CEO Robin Vince has done an exceptional job since taking over four years ago. Major US banks as a whole are aggressively retiring stock in 2026 due to recent deregulation, with a record $33 billion bought back in the first quarter alone—up 35% from the prior year quarter. This is the type of “double play” return we seek; an undervalued, vital, dull business with inspired management improving operating results leading to a sixfold return on our investment.
Industrials were the best performing sector during the quarter relative to the overall Fund, due in part from strong reshoring thanks to low domestic natural gas prices, legislation like the CHIPS and Inflation Reduction Acts as well as geopolitical risks that incentivize companies to return manufacturing to the US. Last year’s massive increase in hyperscaler capital expenditures continues, projected to be over $650 billion this year and may account for up to half of US GDP growth. Strong performers in the Fund included Gates (GTES), Caterpillar (CAT), Corning (GLW), and FedEx (FDX). Corning has seen strong demand for their optical connectivity products used in AI-focused data centers. Corning CEO Wendell Weeks is impressive in his ability to execute.
Defense and aerospace companies Boeing, Parker-Hannifin (PH), General Dynamics and RTX have reaped the benefits of a massive increase in global defense spending in response to rising conflicts.
Skilled labor educators Lincoln Educational (LINC) and Universal Technical Institute (UTI) have reported strong growth in student starts as demand for trades continues to rise. The expansion of data centers has led to high demand for electricians, HVAC technicians, welders and CNC machining engineers. AI automation is expected to impact many professional industries, driving interest in trades that are viewed as more resistant to disruption. Reshoring trends in the US specifically in the semiconductor and defense industries are also contributing to strong student starts.
Energy refiners Valero (VLO) and Phillips 66 (PSX) outperformed with diesel and Jet A fuel prices soaring. The crack spread hit a record $88.25 per barrel of oil in March. Chevron (CVX) has been a major beneficiary of years of diligent investments in oil and gas production.
Detractors
UnitedHealth (UNH) has been a major laggard for the past quarter and year. However, since CEO Stephen Hemsley’s return last May operating performance has been improving. We made over a fivefold return under his previous tenure from 2006-2017 and are confident that he can navigate a successful turnaround going forward. The recent medical cost ratio (MCR) of 83.9% is the lowest in two years and combined with a 2.48% CMS rate increase this spring has been a big boost. The lower amount spent on patient medical claims follows the company’s late 2025 shift to focus on higher margin patients over aggressive membership growth. Total membership has fallen by about 700,000 since the end of 2025. Management cited their higher margins as the reason for raising their full year adjusted earnings per share guidance to over $18.25, up from their previous guidance of $17.75 in January and consensus estimates of $17.86. Going forward, management also announced at least $1.5 billion in spending on artificial intelligence technology in 2026. This technology will be focused on areas like helping members understand their coverage and automating some administrative tasks and claims processing.
Software-related stocks in the portfolio have been hit hard due to the threat of margin compression from artificial intelligence. Microsoft (MSFT)’s 21.9% drop in the quarter was the worst decline since the 2008 financial crisis. They are spending $190 billion on AI-related capital expenditures in 2026 yet their AI Copilot product has failed to scale, with less than 15 million total paid seats. Google Gemini has successfully integrated their AI and captured the largest share of casual AI users with 2 billion people interacting with “Gemini-powered AI overviews” in Google Search every month. Microsoft has a large installed base with Fortune 500 companies. They have over $88 billion in cash on the balance sheet which is a huge competitive advantage. It is hard to bet against CEO Satya Nadella who took over in February 2014 and has a great record with the stock up over elevenfold.
First Quarter 2026 Performance Update
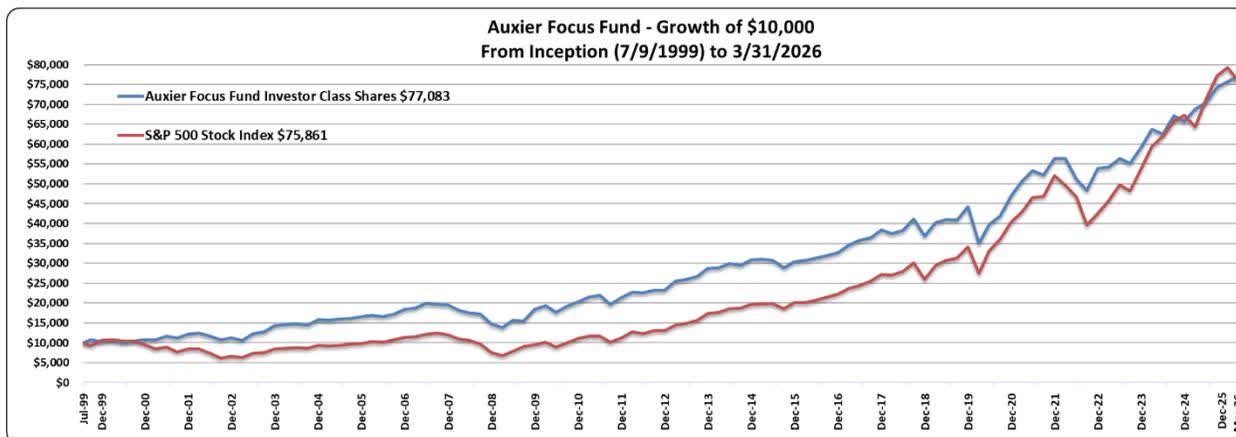

Auxier Focus Fund’s Investor Class gained 1.73% in the first quarter of 2026 with stocks up 2.00%. For the same period the S&P 500 cap-weighted index declined 4.33% and the equal weight returned 0.67%. The Russell 1000 Value was up 2.10%. For the quarter, fixed income investments as measured by the S&P US Aggregate Bond Index returned 0.04% and the longer-dated ICE US Treasury 20+ Year Index was up 0.11%. Stocks in the Fund comprised 92% of the portfolio. The breakdown was 82.5% domestic and 9.5% foreign, with 8.0% in short-term debt instruments. A hypothetical $10,000 investment in the Fund from inception on July 9, 1999 to March 31, 2026 is now worth $77,083 vs $75,861 for the S&P 500 and $65,542.76 for the Russell 1000 Value Index. During the same period, equities in the Fund (entire portfolio, not share class specific) have had a gross cumulative return of 1,323.34% vs 658.61% for the S&P. The Fund had an average exposure to the market of 82% over the entire period. Our results are unleveraged.
In Closing
We continue to seek businesses and managements displaying a strong culture with a heart and soul. Great leadership combined with enduring business models purchased in periods of fear and uncertainty have generated most of our returns over the past three decades. We have had good luck
with gritty founder CEOs who love their business. There is however a shortage of great operators. The key is to identify these managers and businesses ahead of time and do vigorous daily research to determine the sustainable earnings power of each entity. While we are aggressively monitoring the risks of a continued Strait of Hormuz shutdown, we remain mindful that many opportunities can be missed by focusing too much on macro headlines and not enough on micro details of improving operating fundamentals with exceptional leaders. Program trading dominates the investment landscape, but we firmly believe that investing is still the craft of the specific and knowing what you own is crucial to mitigating risk and improving investment odds.
Finally, during this time of global turmoil Warren Buffett said it best: “What we learn from history is that people do not learn from history. You can count on fear, greed and folly to be ever present in the marketplace. Their sequence is unpredictable; their duration is unpredictable; and their effects are unpredictable. But their presence is certain. ” Emotional and psychological responses to money often lead to substantial misappraisals in auction markets, creating new opportunities.
We appreciate your trust.
Jeff Auxier
Editor’s Note: The summary bullets for this article were chosen by Seeking Alpha editors.
Editor’s Note: This article covers one or more microcap stocks. Please be aware of the risks associated with these stocks.