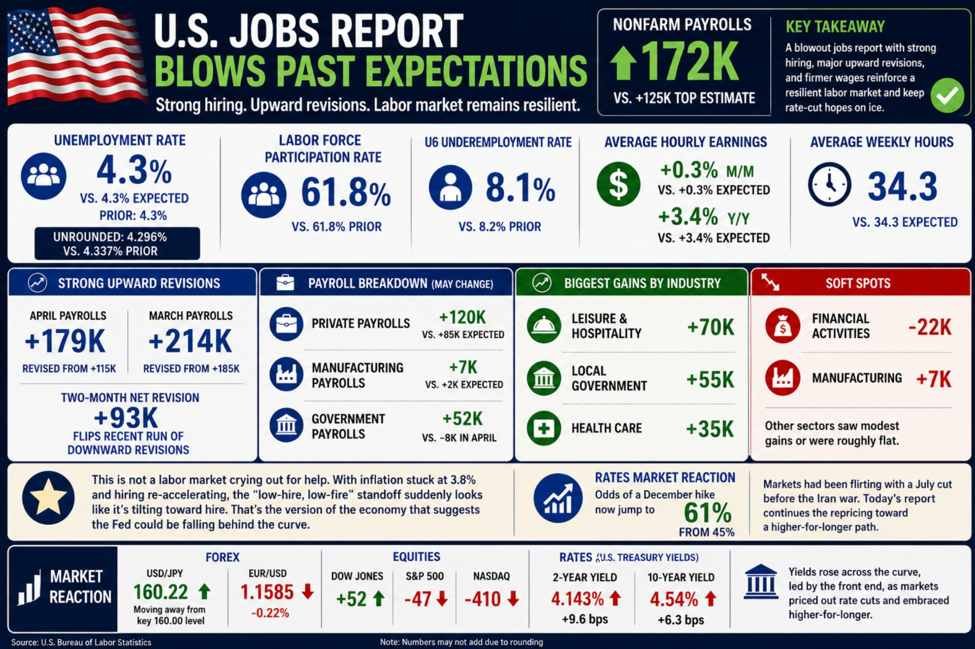
The USD is sharply higher following a much stronger-than-expected U.S. employment report. Nonfarm payrolls increased by 172K, well above the 85K forecast, while sizeable upward revisions added another 93K jobs to the prior two months. The unemployment rate held steady at 4.3%, average hourly earnings rose 0.3% on the month and 3.4% year-over-year, and the participation rate remained unchanged. Taken together, the report points to a labor market that remains resilient and is not showing signs of meaningful deterioration.
The USDJPY initially surged to its highest level since May 1, reaching 160.22, but remains below the next key upside target at 160.446, the March 30 swing high. Above that level, traders would look toward the 2026 high of 160.717 from April 30. However, gains above 160.00 continue to attract caution as traders remain sensitive to the risk of official intervention, even in the absence of any direct warnings from Japanese authorities.
After probing higher, the pair briefly pulled back before finding buyers once again. The 160.00 level remains a critical barometer for the pair. Staying above that threshold keeps buyers firmly in control. On the downside, the 100-hour moving average at 159.856 and the 200-hour moving average at 159.601 serve as important support levels. A move below those averages would weaken the bullish bias and shift the technical outlook more to the downside. Until then, the path of least resistance remains higher, with buyers maintaining the upper hand.
The EURUSD has moved lower and is now testing an important support zone between 1.1576 and 1.1587. The low price has reached 1.1584 so far, putting the pair near the lower end of that key swing area. A break below the floor at 1.1576, and more importantly, the ability to stay below that level, would likely increase bearish momentum and open the door for a deeper move to the downside.
From a technical perspective, the pair has already fallen below the trendlines highlighted on the hourly chart and is moving further away from its 100-hour moving average at 1.16225 and 200-hour moving average at 1.16287. Those moving averages now act as resistance and reinforce the bearish bias. While sellers remain in control, the next key test is whether they can force and sustain a break below 1.1576. Accomplishing that would strengthen the downside case and give sellers greater control of the short-term trend.