Often, the price action on a chart tells a story that is far more important to traders than the latest fundamental headline. That story is centered on one thing: risk management. Successful traders are constantly looking for levels they can lean against—areas where they can define their risk tightly while maintaining the potential for a much larger reward.
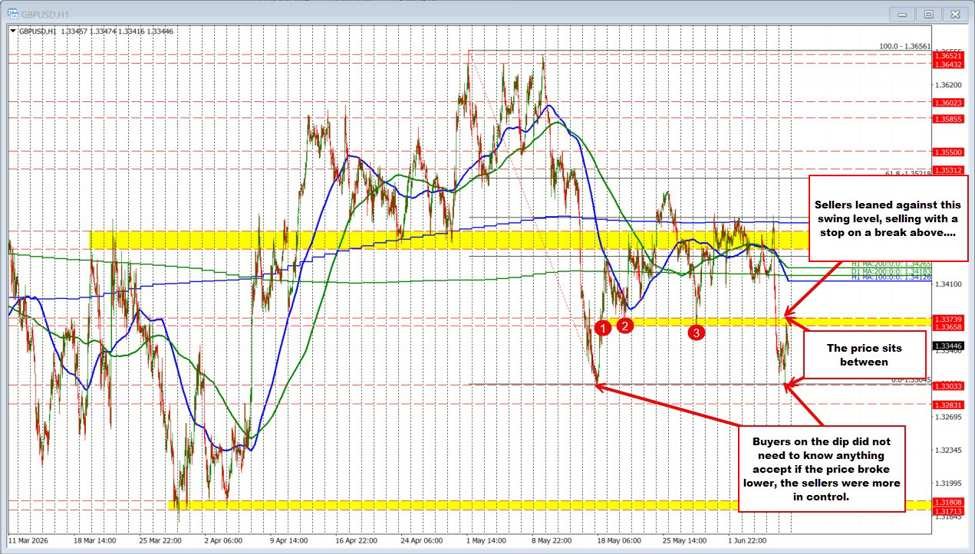
Looking at the GBPUSD hourly chart, the low price today reached 1.3306, coming within just 1.5 pips of the key swing low established in May. That proximity gave buyers a clear risk-defining level. Traders willing to buy near support could place a stop just below the May low, risking only a small amount if the level failed. The support held, buyers stepped in, and the price began to rotate higher. Those traders were able to risk a little in pursuit of making considerably more.
The subsequent rally carried the pair back toward a well-defined swing area between 1.33658 and 1.33739, marked by a series of swing lows dating back to mid-May (see red circles on the chart below). What had been support was broken on Friday, turning it into a potential resistance zone. As the price rebounded today, sellers had their own risk-defined opportunity. They could lean against that resistance area and place stops on a move above it, once again risking a little for the possibility of making more than a little.
The resistance zone held, and the price has since rotated back lower into the middle of the broader trading range between 1.3304 and 1.33739. As a result, the market remains caught in a battle between buyers defending support below and sellers protecting resistance above.
The key point is that both sides are operating from levels that are visible to everyone. These are not fundamental opinions or forecasts. They are objective price levels that allow traders to clearly define their risk. In the end, that ability to manage risk—not predict the future—is what often drives trading decisions and creates the story the chart is telling.
What next?
Ultimately the price going to trade outside of that range. Traders will start to look for a break and momentum in the direction of the break. In the video above I explained the dynamics in the targets in either direction when there is a break.