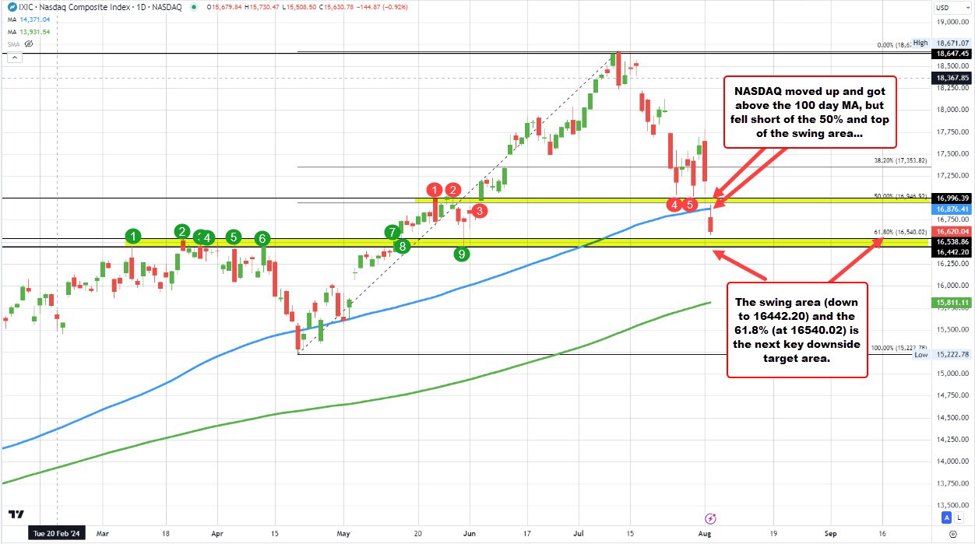
The Nasdaq index opened lower, rallied up and briefly moved above the 100-day MA at 16876.83 Just above that sits at the 50% of the move up from the May low to the July high. That level came in at 16946.92. THe high price today reached 16920.63 between the two levels. Buyers turned to sellers.
The price moved lower off that level to a low for the day at 16582.79. The next target is at 16540.02. That is the 61.8% of the same move higher. That level is also the high of a swing area between 16442 and 16540 (see green numbered circles on the chart above).
So the support and resistance levels are set with the current price between the support (down to 16442) and resistance (up to 16946.97).
For the S&P index, it tested/broke briefly below its 100-day MA at 5307. THe low price today reached 5305.98 just below that level.. The 50% is just above the 100-day MA at 5311.62. The price decline survived the first break below those levels. The current price is trading at 5316. Watch that level today and going forward. If the support can hold, we could see a bounce. If broken, it opens the downside for more selling.
So both the 100 day and 50% retracement levels are in play for both the major broad indices. However, from different perspectives. For the NASDAQ the level are upside resistance. For the S&P they represent downside support.
Be aware.