William_Potter
Investment Thesis
Have you ever thought about how you could enhance the investment strategy of your core ETF to boost income generation, further diversify your portfolio, reduce company and sector-specific allocation risk, and further optimize its risk-reward profile?
The aim of today’s article is to provide you with guidance on how to build a $50,000 dividend portfolio with Schwab U.S. Dividend Equity ETF (NYSEARCA:SCHD) as a core position and enhancing this ETF with 10 individual positions to provide you with additional benefits when compared to solely investing in SCHD.
I have selected the following positions to be part of this dividend portfolio in addition to SCHD:
- Realty Income (O)
- NNN REIT (NNN)
- Ares Capital (ARCC)
- HSBC (HSBC)
- BlackRock TCP Capital (TCPC)
- VICI Properties (VICI)
- Visa (V)
- Apple (AAPL)
- Microsoft (MSFT)
- Allianz (OTCPK:ALIZF)
This dividend portfolio provides you with the following benefits when compared to only investing in SCHD:
- Stronger ability for the generation of dividend income: while SCHD offers investors a Dividend Yield [TTM] of 3.39%, the Weighted Average Dividend Yield [TTM] of this portfolio stands at 3.86%. This indicates a superior capacity for income generation compared to only investing in SCHD.
- Additional diversification across sectors: while SCHD is not invested in the Real Estate Sector, I have added three companies from it (Realty Income, NNN REIT, and VICI Properties). This ensures an increased sector diversification and a reduced sector-specific allocation risk.
- Optimized Risk-Return Potential: By including attractive risk-reward companies such as Microsoft, Visa and Apple to this dividend portfolio, we further optimize its risk-return potential when compared to only investing in SCHD. By only investing in SCHD, you would not be able to benefit from the elevated risk-return potential of these industry leaders.
- Reducing the Company-Specific Allocation Risk: while six companies that are part of SCHD account for more than 4% of the ETF, I have ensured that this portfolio has a reduced company-specific allocation risk. No company accounts for more than 4% of the overall portfolio, even when allocating SCHD across the companies it is invested in.
I would like to highlight that the dividend portfolio presented in today’s article offers investors a Weighted Average Dividend Yield [TTM] of 3.86%, and has shown a 5-Year Weighted Average Dividend Growth Rate [CAGR] of 10.85%, effectively blending the generation of dividend income and the potential for dividend growth.
Since SCHD is not invested in the Real Estate Sector, I have selected three individual positions from this sector (Realty Income, NNN REIT and VICI Properties) to further enhance the benefits SCHD already provides investors with. This approach allows us to reach a broader portfolio diversification than by only investing in SCHD.
In addition, it is worth highlighting that Realty Income, NNN REIT and VICI Properties combine dividend income and dividend growth, which makes them ideal candidates to further enhance the investment approach of SCHD.
Microsoft and Visa have been selected for this portfolio thanks to their strong financial health, competitive advantages and dividend growth potential, allowing the portfolio to potentially reach strong dividend growth and elevated potential for capital appreciation.
I have selected Ares Capital and BlackRock TCP Capital given their enormous capacity for the generation of dividend income, evidenced by their Dividend Yield [TTM] of 9.18% and 14.55%, respectively. Including these picks in our dividend portfolio allows us to reach a higher Weighted Average Dividend when compared to solely investing in SCHD.
While SCHD provides investors with a Dividend Yield [TTM] of 3.39%, this portfolio offers investors a Weighted Average Dividend Yield [TTM] of 3.86%, indicating a higher capacity for the generation of dividend income when compared to an investment only in SCHD.
I have selected Allianz (from Germany) and HBSC (United Kingdom), given their strong capacity to combine dividend income and dividend growth and to further diversify our portfolio geographically.
Apple has been selected because of its low-risk level, financial health (Return on Equity of 160.58% and AAA credit rating from Moody’s), and its large share buyback program from which investors can benefit in addition to its dividend growth potential.
Overview of SCHD
Holdings Breakdown
SCHD is predominantly invested in the Financials Sector (which accounts for 17.99% of the ETF), the Health Care Sector (16.07%), the Consumer Defensive Sector (14.74%), the Energy Sector (11.91%), and the Industrials Sector (11.82%).
SCHD’s Mix of Dividend Income and Dividend Growth
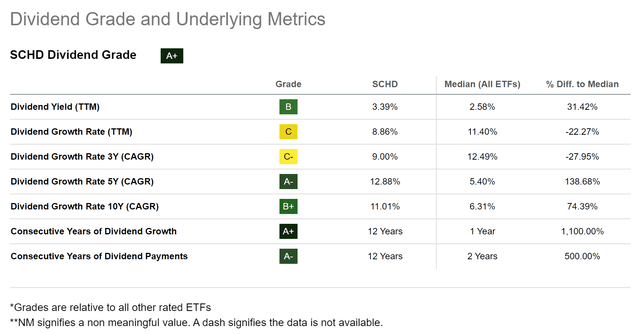
The below metrics illustrate why SCHD can be such an effective core position of your dividend portfolio to effectively balance dividend income and dividend growth.
While the Dividend Yield [TTM] of the Median of all ETFs stands at 2.58%, and the 5-Year Dividend Growth Rate [CAGR] of the Median of all ETFs is 5.40%, SCHD’s metrics are 3.39% and 12.88% respectively. These numbers highlight SCHD’s superior capacity to blend dividend income with dividend growth when compared to the average ETF.
Overview of the Composition of This Dividend Portfolio
|
Symbol |
Name |
Sector |
Industry |
Country |
Market Cap in $B |
Dividend Yield [TTM] |
Payout Ratio |
Dividend Growth 5 Yr [CAGR] |
Allocation |
Amount in $ |
|
SCHD |
Schwab U.S. Dividend Equity ETF |
ETF |
ETF |
United States |
3.39% |
12.88% |
70.00% |
35000 |
||
|
V |
Visa |
Financials |
Transaction & Payment Processing Services |
United States |
530.0 |
0.78% |
21.51% |
15.77% |
3.00% |
1500 |
|
AAPL |
Apple |
Information Technology |
Technology Hardware, Storage and Peripherals |
United States |
3454.1 |
0.43% |
14.76% |
5.50% |
3.00% |
1500 |
|
MSFT |
Microsoft |
Information Technology |
Systems Software |
United States |
3073.5 |
0.72% |
25.40% |
10.27% |
3.00% |
1500 |
|
ALIZF |
Allianz |
Financials |
Multi-line Insurance |
Germany |
108.3 |
4.96% |
64.00% |
8.02% |
3.00% |
1500 |
|
HSBC |
HSBC |
Financials |
Diversified Banks |
United Kingdom |
121.5 |
6.99% |
52.60% |
3.65% |
3.00% |
1500 |
|
TCPC |
BlackRock TCP Capital |
Financials |
Asset Management and Custody Banks |
United States |
0.8 |
14.55% |
75.56% |
-1.14% |
2.00% |
1000 |
|
O |
Realty Income |
Real Estate |
Retail REITs |
United States |
53.8 |
5.07% |
75.13% |
3.55% |
4.00% |
2000 |
|
NNN |
NNN REIT |
Real Estate |
Retail REITs |
United States |
8.6 |
4.88% |
68.52% |
2.46% |
3.00% |
1500 |
|
ARCC |
Ares Capital |
Financials |
Asset Management and Custody Banks |
United States |
13.2 |
9.18% |
79.34% |
3.97% |
3.00% |
1500 |
|
VICI |
VICI Properties |
Real Estate |
Other Specialized REITs |
United States |
34.7 |
5.05% |
74.77% |
7.62% |
3.00% |
1500 |
|
3.86% |
10.85% |
100.00% |
50,000 |
Source: The Author, data from Seeking Alpha
Risk Analysis
Risk Analysis of the Portfolio Allocation per Company/ETF
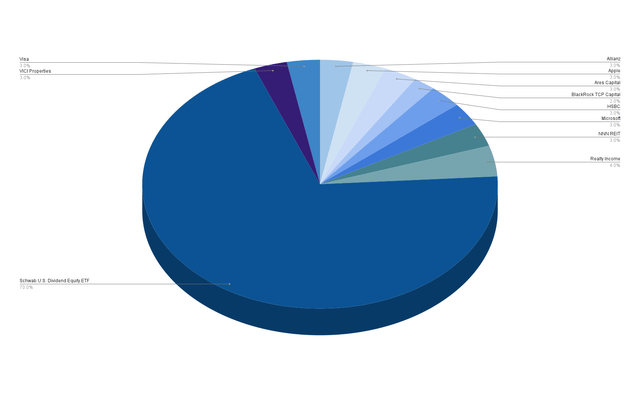
I have selected 10 individual companies which, I believe, are complementary to SCHD, which serves as a core position of this dividend portfolio. I have allocated 70% of the overall portfolio to SCHD. This high allocation ensures that no individual position accounts for more than 4% of the overall portfolio, ensuring a reduced company-specific allocation risk.
With a proportion of 4%, Realty Income is the largest individual position of this dividend portfolio.
Visa, VICI Properties, NNN REIT, Microsoft, HSBC, Ares Capital, Apple and Allianz each account for 3%.
With a proportion of 2% of the overall portfolio, BlackRock TCP Capital represents the smallest position. This is due to its elevated risk level.
Risk Analysis of the Portfolio’s Company-Specific Concentration Risk When Distributing SCHD Across its Sectors
The graphic below illustrates the composition of this dividend portfolio when allocating SCHD across the companies it is invested in. The graphic shows all positions that account for more than 2.5% of the portfolio.
With a proportion of 4.00%, Realty Income makes up the largest position when distributing SCHD across its respective companies.
The second and third-largest positions of this dividend portfolio are Lockheed Martin and AbbVie, representing 3.16% and 3.14%. It is important to highlight that neither Lockheed Martin nor AbbVie have been selected as individual positions. However, SCHD holds a significant stake in both companies, leading to their large proportion of this dividend portfolio.
Source: The Author, data from Seeking Alpha and Morningstar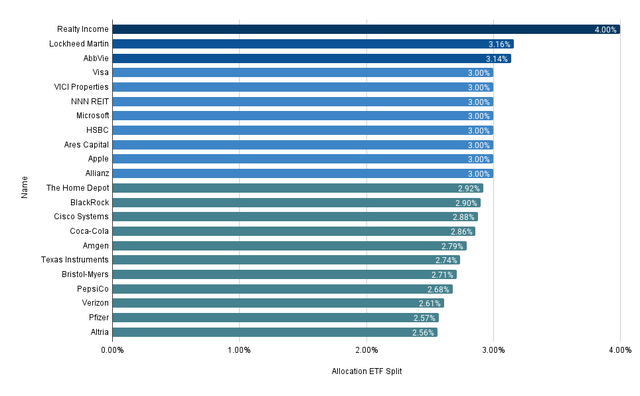

Risk Analysis: The Return on Equity of The 10 Individual Positions of This Dividend Portfolio
The graphic below demonstrates the Return on Equity of the 10 individually selected companies that are part of this dividend portfolio.
Due to their relatively low Dividend Yield, neither Apple, Visa or Microsoft contribute significantly to the income generation of this portfolio. However, I believe they are still important positions because of their dividend growth potential, competitive advantages and enormous financial health. These company characteristics are important to ensure an elevated potential for our portfolio to achieve dividend growth and capital appreciation.
Apple, Visa and Microsoft’s financial health is underscored by their Return on Equity of 160.58%, 48.55%, and 37.13%, respectively.
Source: The Author, data from Seeking Alpha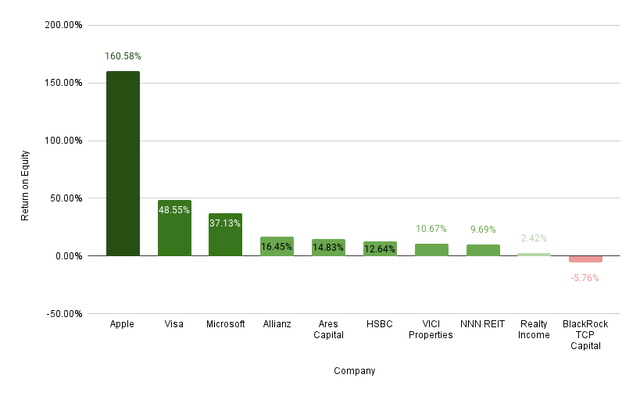

From the 10 individually selected companies, only BlackRock TCP Capital has a negative Return on Equity (-5.76%), which has contributed to my decision to underweight the company within this dividend portfolio.
Risk Analysis: The Dividend Yield [TTM] and 5-Year Dividend Growth Rates [CAGR] of The 10 Individual Positions of This Dividend Portfolio
The chart below illustrates that almost all of the 10 individually selected companies combine dividend income with dividend growth.
Nine of them have shown a positive 5-Year Dividend Growth Rate [CAGR] and pay a dividend.
From the 10 companies, only BlackRock TCP Capital has shown a negative 5-Year Dividend Growth Rate [CAGR] of -1.14%. However, it should be highlighted that BlackRock TCP Capital strongly contributes to the generation of dividend income, evidenced by the company’s Dividend Yield [TTM] of 14.55%.
Both Visa (with a 5-Year Dividend Growth Rate [CAGR] of 15.77%) and Microsoft (10.27%) have shown double digit dividend growth rates. I believe they are crucial positions to provide our investment portfolio with dividend growth.
Source: The Author, data from Seeking Alpha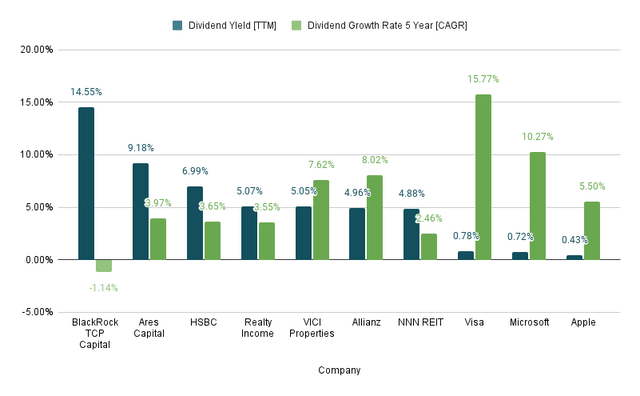

Due to the careful selection process of the companies, I believe that this dividend portfolio has strong dividend growth potential and offers investors a reduced risk level, positioning it to reach attractive investment results when investing over the long term.
Risk Analysis: The Consecutive Years of Dividend Growth of The 10 Individual Positions of This Dividend Portfolio
The chart below further highlights the dividend growth potential of the individually selected companies, strengthening my belief that this portfolio is not only attractive for investors aiming to balance dividend income and dividend growth, but also for those looking for capital appreciation.
NNN REIT and Realty Income have shown 33 and 26 Consecutive Years of dividend growth, underscoring that they are important core elements of this dividend portfolio, positioning it for enhanced dividend growth potential.
Microsoft, Visa and Apple have shown 19, 15 and 10 Consecutive Years of dividend growth, respectively, further strengthening my thesis that this dividend portfolio is effectively positioned for future dividend growth.
Source: The Author, data from Seeking Alpha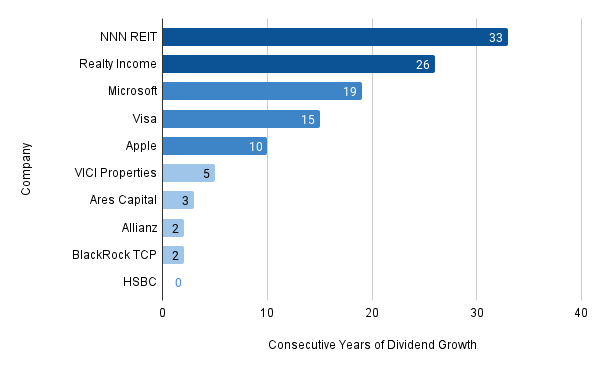

Risk Analysis: The Payout Ratios of The 10 Individual Positions of This Dividend Portfolio
The chart below further illustrates the dividend growth potential and potential for capital appreciation this dividend portfolio provides investors with. The dividend growth potential is underlined by the attractive Payout Ratios of the individually selected companies, indicating scope for potential dividend enhancements.
The five companies with the lowest Payout Ratio from the 10 individually selected companies are Apple (Payout Ratio of 14.76%), Visa (21.51%), Microsoft (25.40%), HSBC (52.60%) and Allianz (64.00%).
Source: The Author, data from Seeking Alpha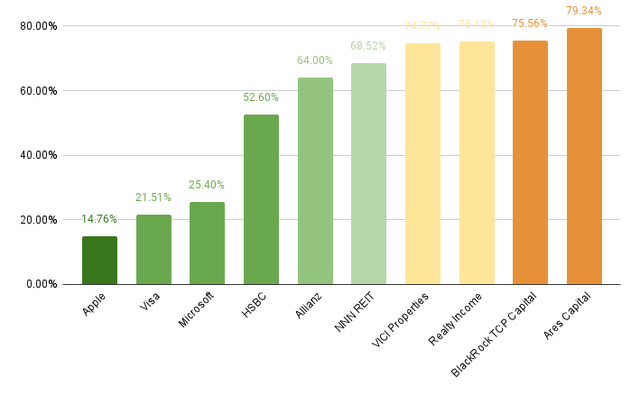

None of the individually selected companies exhibits a Payout Ratio above 80%, further underscoring my investment thesis that this portfolio offers investors a balanced approach of dividend income and dividend growth, as well as strong potential for dividend enhancements and capital appreciation in the years ahead.
Risk Analysis of the Portfolio’s Sector-Specific Concentration Risk When Distributing SCHD Across its Sectors
The chart below demonstrates the increased proportion of the Real Estate Sector within this dividend portfolio compared to investing in SCHD alone. While SCHD is not invested in the Real Estate Sector, this sector represents 10.00% of this dividend portfolio. By incorporating companies such as Realty Income, NNN REIT and VICI Properties, we have significantly enhanced the diversification of this portfolio and effectively reduced its sector-specific allocation risk compared to investing in SCHD alone.
Source: The Author, data from Seeking Alpha and Morningstar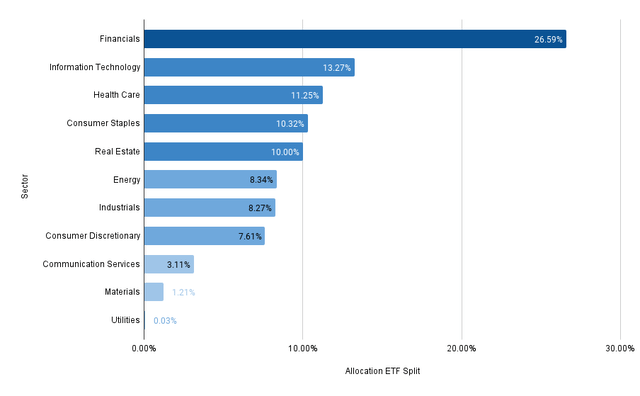

Conclusion
The main objective of this article was to demonstrate how you can use SCHD as a core element of your dividend portfolio, while enhancing it with 10 dividend paying companies to provide you with greater benefits compared to investing in SCHD alone.
The portfolio offers you a Weighted Average Dividend Yield [TTM] of 3.86%, along with a 5-Year Weighted Average Dividend Growth Rate [CAGR] of 10.85%.
These metrics demonstrate its superior capacity for the production of dividend income. The Dividend Yield [TTM] of SCHD is presently at 3.39%, which is inferior to the 3.86% this dividend portfolio offers.
By including companies from the Real Estate Sector such as Realty Income, NNN REIT and VICI Properties, we enhance the portfolio’s diversification while reducing its sector-specific allocation risk. This also allows you to benefit from the performance of a sector you would not benefit from when investing in SCHD alone.
I further believe that this dividend portfolio offers investors a superior risk-return potential when compared to only investing in SCHD. This is particularly the case thanks to the inclusion of financially healthy companies with strong dividend growth potential (such as Visa and Microsoft) and a company with a large share buyback program from which investors strongly benefit over the long term (Apple).
Additionally, this portfolio offers geographical diversification, by including companies such as Allianz (Germany) and HSBC (United Kingdom), which offers investors attractive risk-reward profiles and combines dividend income with dividend growth at the same time.
An increased Weighted Average Dividend Yield [TTM] of 3.86% compared to SCHD’s Dividend Yield [TTM] of 3.39%, enhanced portfolio diversification (particularly due to the inclusion of companies such as Realty Income, NNN REIT and VICI Properties), a superior risk-return potential (especially due to the inclusion of Visa and Microsoft) and geographical diversification (through Allianz and HSBC) are important benefits for investors when compared to only investing in SCHD.
Do you agree? Feel free to share any feedback on this dividend portfolio allocation article in the comments section below. It would be great to know which 10 companies you would select to complement SCHD as a core element within a well-balanced dividend portfolio.
Editor’s Note: This article discusses one or more securities that do not trade on a major U.S. exchange. Please be aware of the risks associated with these stocks.


