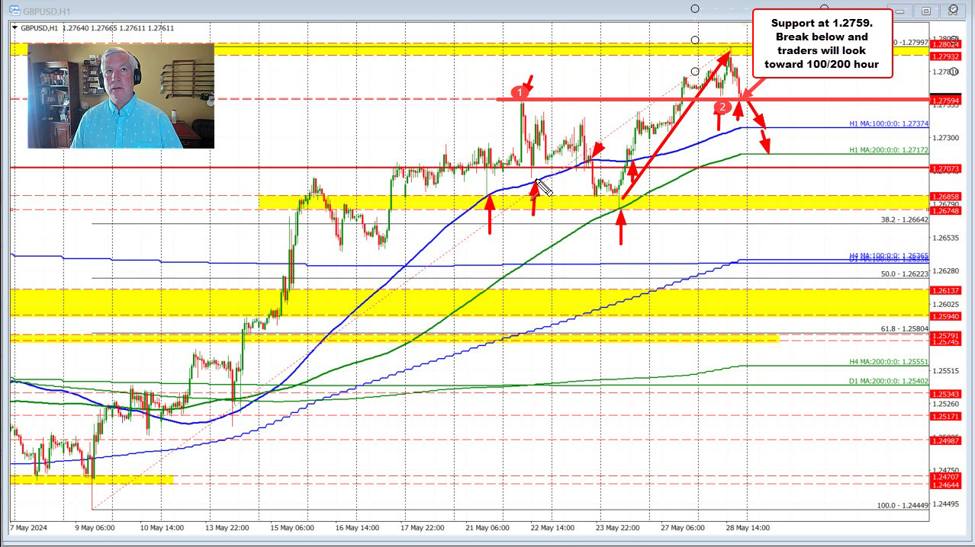
The GBPUSD moved higher earlier in the day stalled near the swing area between 1.2793 and 1.2802. The area also had the advantage of being at a natural resistance at 1.2800. Sellers leaned and pushed the price back lower.
The move to the downside is currently testing a swing level at 1.2759. That level was the swing high going back to May 22. The price broke above that level yesterday and retested it earlier today in the European session. This is the third test of the level.
Going forward, breaking below, and traders would target the rising 100-hour moving average at 1.2737 (blue line on the chart below). Moving below that level, and the rising 200-hour moving average at 1.2717 would be targeted. Last Friday, the price bounced off of that 200 hour moving average level increasing its importance from a technical perspective.
If the 1.2759 level holds support, the buyers remain in full control with a retest of the 1.2800 area likely.
GBPUSD tests swing level. Break below and more probing