Fundamental
Overview
The USD has been rallying
steadily against most major currencies in the recent couple of weeks, although
the catalyst behind the move has been unclear. A good argument has been that
most of the moves we’ve been seeing were driven by deleveraging from
strengthening Yen.
Basically, the squeeze on
the carry trades impacted all the other markets. Given the magnitude of the
recent appreciation in the Yen and the correlation with many other markets, it
looks like this could have been the reason indeed. It will be interesting to
see how things evolve in the next days now that the BoJ decision is in the
rear-view mirror and if this correlation fades.
From the monetary policy
perspective, we had the FOMC rate decision yesterday and as expected it was a dovish
one. Fed Chair Powell hinted to a September rate cut and didn’t even close the
door for “several” rate cuts before the end of the year. The market continues
to expect at least two rate cuts by the end of the year and sees some chances
of a back-to-back cut in November.
The data continues to
suggest that the US economy remains resilient with inflation slowly falling
back to target. Overall, this should continue to support the soft-landing
narrative and be positive for the general risk sentiment as the Fed is going to
cut into resilient growth.
The AUD, on the other hand,
has been supported against the US Dollar in the past months mainly because of
the risk-on sentiment, although the recent events with the Yen boosted the US
Dollar against most major currencies. The Australian Dollar was also helped by
the hawkish expectations for the RBA given the sticky inflation data.
Those hawkish expectations
were finally put to rest yesterday as the Australian
Q2 CPI report came in on the softer side. That should give the RBA more
confidence to hold rates steady.
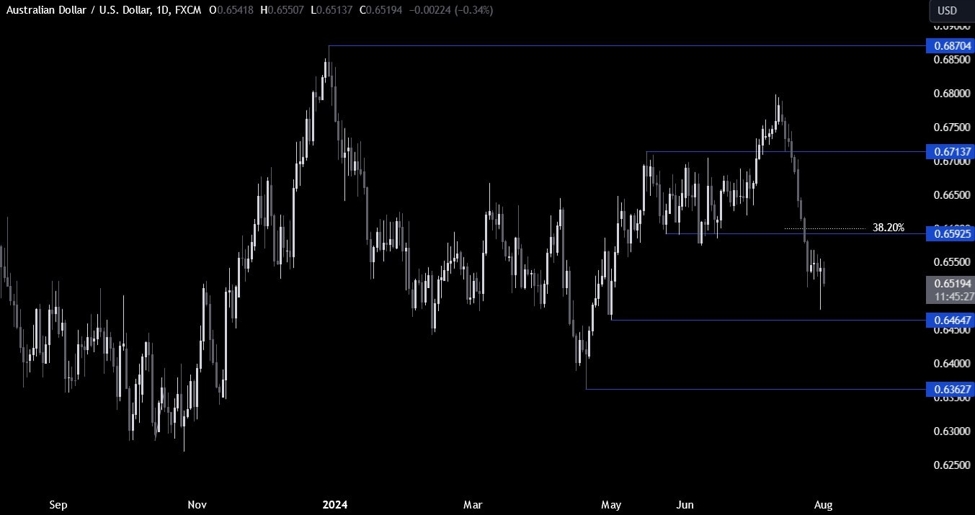
AUDUSD
Technical Analysis – Daily Timeframe
AUDUSD Daily
On the daily chart, we can
see that AUDUSD after breaking below the key 0.66 support zone, extended the drop towards the next key level
at 0.6464. It looks like we got a final spike lower on a softer than expected Australian
CPI report and the pair is now bottoming out.
From a risk management
perspective, the sellers will have a much better risk to reward setup around
the 0.66 resistance where we can also find the confluence
of the 38.2% Fibonacci
retracement level of the entire selloff. The buyers, on the other hand,
will want to see the price breaking above the resistance to regain control and
increase the bullish bets into a new cycle high.
AUDUSD Technical
Analysis – 4 hour Timeframe
AUDUSD 4 hour
On the 4 hour chart, we can
see that we are having some consolidation around the 0.65 handle. There’s not
much else to glean from this timeframe as the price is trading right in the
middle of the two key levels, so we need to zoom in to see some more details.
AUDUSD Technical
Analysis – 1 hour Timeframe
AUDUSD 1 hour
On the 1 hour chart, we can
see that we have an interesting support zone around the 0.6510 level where the
price reacted from several times in the past days. This is where we can expect
the buyers to step in with a defined risk below the support to position for a
rally into the 0.66 resistance. The sellers, on the other hand, will want to
see the price breaking lower to increase the bearish bets into the 0.6464
level. The red lines define the average daily range for today.
Upcoming
Catalysts
Today we get the latest US Jobless Claims figures and the US ISM
Manufacturing PMI. Tomorrow, we conclude the week with the US NFP report.