Fundamental
Overview
The USD yesterday was sold across
the board following the soft US
CPI report. The data made the market to price back in two cuts for this
year. Later in the day though we got a bit more hawkish than expected FOMC
decision where the dot
plot showed that the Fed sees just one cut for this year despite the soft
US CPI report.
This gave the greenback a boost,
but Fed Chair Powell backpedalled
on the projections making them a bit less worrying as the central bank remains
very data dependent. So, all in all, the US Dollar might still come under
pressure as the risk sentiment should improve thanks to the soft US CPI.
The AUD, on the other hand,
has been supported by a slightly more hawkish RBA and the positive risk
sentiment due to the pickup in global growth. Moreover, the pickup in China’s
economy is generally good news for the Aussie as well as it’s Australia’s
biggest trading partner.
Today, we also got a good Australian
labour
market report which doesn’t change anything for the RBA but should still
keep the currency supported in case we go back into risk-on.
AUDUSD
Technical Analysis – Daily Timeframe
AUDUSD Daily
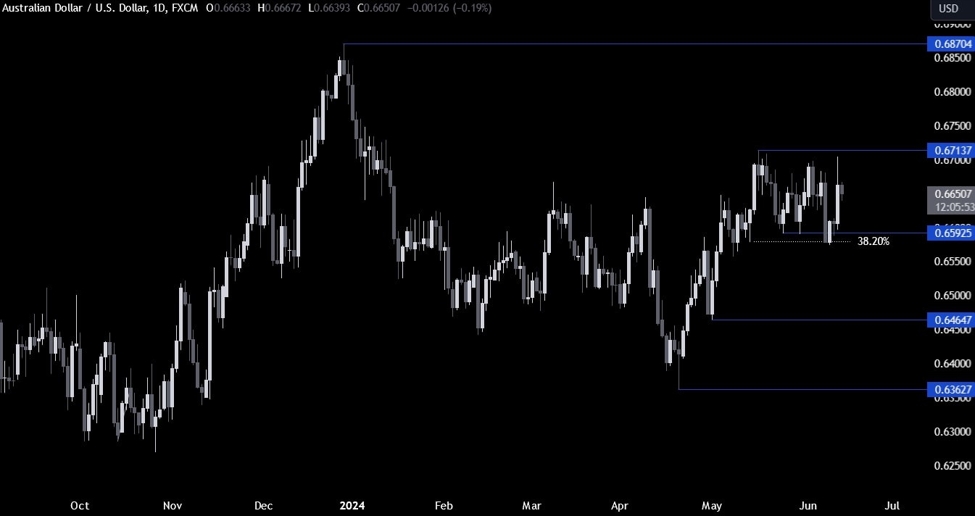
On the daily chart, we can
see that AUDUSD spiked into the top of the range around the 0.67 handle following
the US CPI release. The sellers stepped in with a defined risk above the resistance
to position for a drop back into the bottom of the range. The buyers will want
to see the price breaking above the resistance to gain even more conviction and
start targeting the 0.6870 level.
AUDUSD Technical Analysis – 4 hour Timeframe
AUDUSD 4 hour
On the 4 hour chart, we can
see more clearly the rangebound price action between the 0.67 resistance and
the 0.66 support. The price at the moment is right in the middle of the range,
so from a risk management perspective there’s not much to do here although if
the momentum were to change on the lower timeframe, we could see the bullish
sentiment picking up steam.
AUDUSD Technical
Analysis – 1 hour Timeframe
AUDUSD 1 hour
On the 1 hour chart, we can
see more clearly the spike on the US CPI release and the pullback on the more
hawkish than expected FOMC decision. If the price were to break above the blue
line around the 0.6667 level, the bullish momentum will likely pick up and we
might see a rally back into the top of the range. The red lines define the average
daily range for today.
Upcoming
Catalysts
Today we have the US PPI and the latest US Jobless Claims
figures. Tomorrow, we conclude the week with the University of Michigan
Consumer Sentiment survey.