Bitcoin has been experiencing heightened volatility after reaching a new all-time high of $126,000 earlier this month. The price has since entered a consolidation phase, hovering near the $120,000 level as traders search for fresh demand. Market sentiment remains divided — some analysts expect Bitcoin to stabilize and prepare for another leg up, while others warn of a possible drop below current levels as momentum cools.
This raises the question that’s echoing across the market: Could this be the first truly different Bitcoin cycle? According to top analyst Darkfost, traditional patterns may not apply this time. “Some claim that a -80% to -90% bear market will occur as usual,” he explains, “but certain data points suggest that this cycle is being built on new foundations.”
Unlike previous cycles driven by retail speculation, this one appears increasingly influenced by institutional participation, ETFs, and long-term holders, all contributing to reduced volatility and deeper market maturity. While corrections remain part of Bitcoin’s DNA, structural changes in demand and liquidity may be redefining how this cycle unfolds. Whether Bitcoin breaks higher or faces a major retracement, one thing is clear — this market is evolving faster than ever before.
Bitcoin’s Fourth Cycle: A Stable and Mature Market Phase
According to top analyst Darkfost, Bitcoin’s current cycle stands out as the most stable in its history. During this bullish phase, BTC has not experienced a single correction exceeding 28%, a stark contrast to previous cycles where violent retracements were common. Most drawdowns have remained within a modest 10%–20% range, and only four corrections have surpassed 25%, marking this as the least volatile Bitcoin cycle so far.
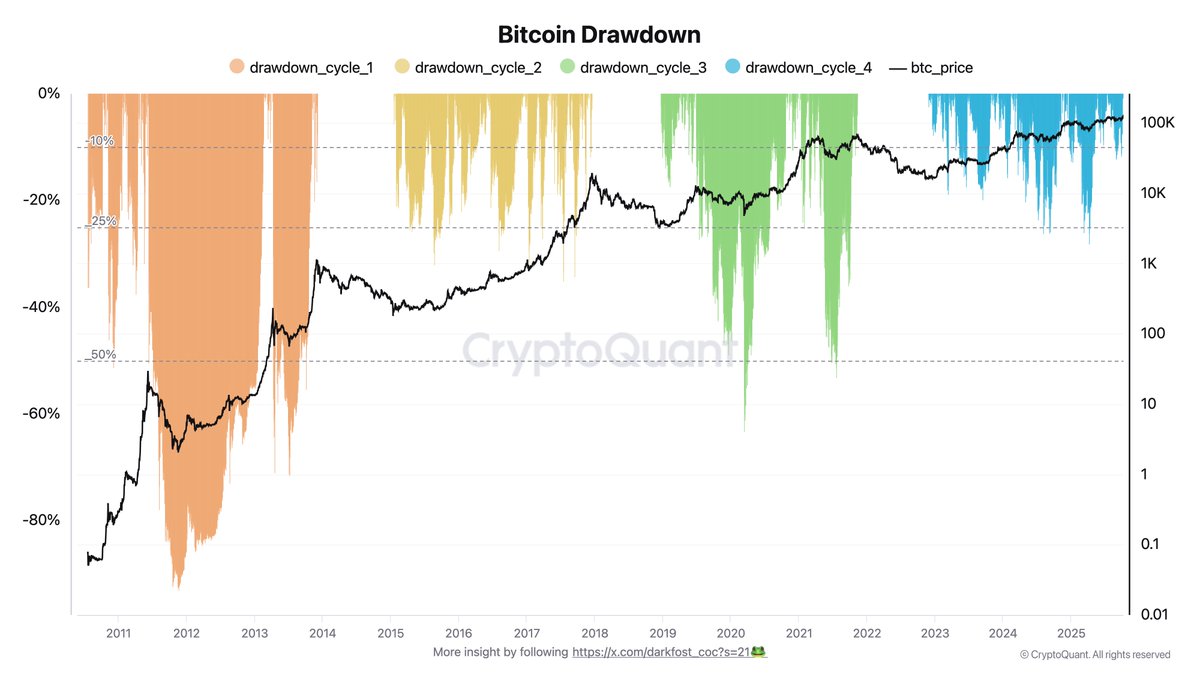
For perspective, between 2020 and 2022, Bitcoin endured multiple 50% drawdowns, creating sharp waves of fear and euphoria that defined the market’s rhythm. Today, the picture is very different. Volatility has dropped to its lowest levels since the last bear market, reflecting a new level of market maturity. As Darkfost points out, this decline in volatility has also led to a tightening of the Bollinger Bands’ standard deviation, signaling growing price stability and disciplined market behavior.
This shift suggests that Bitcoin’s market structure has fundamentally evolved. It no longer mirrors the chaotic, retail-driven cycles of the past. Instead, adoption continues to climb, regulation has become more favorable, and, most importantly, the investor base is changing. Large institutional players and corporate treasuries — particularly in the United States — are entering the market, absorbing selling pressure that once triggered deep corrections.
As a result, Bitcoin’s fourth cycle is rewriting the rulebook, built on deeper liquidity, stronger hands, and long-term conviction rather than speculation. This may be the first cycle where Bitcoin transitions from a volatile asset to a globally recognized, maturing store of value.
Price Consolidation Continues Around $121K
Bitcoin (BTC) is currently trading around $121,800, consolidating after a volatile week that saw strong resistance near the $126,000 all-time high. The 4-hour chart shows that BTC is moving sideways within a narrow range, struggling to reclaim the short-term 50 EMA (blue line), which has now turned into dynamic resistance.
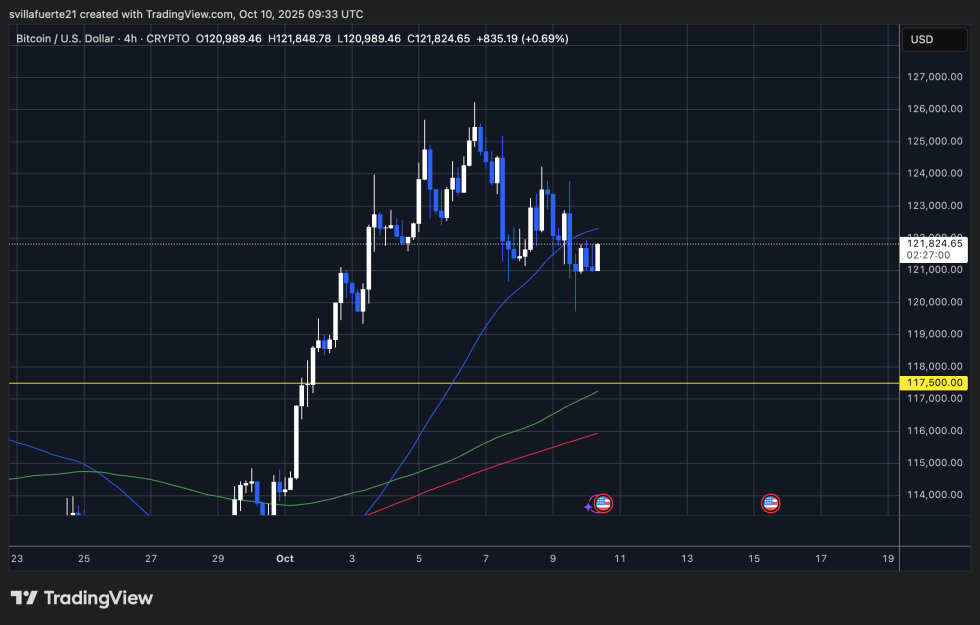
The immediate support level sits near $120,000, while the key horizontal level at $117,500 — highlighted in yellow — remains the most crucial zone to maintain the broader bullish structure. As long as the price holds above this area, the uptrend remains intact, with potential for a renewed push toward the $124,000–$126,000 zone.
Momentum indicators suggest that buyers are still defending critical support, though market indecision dominates. The 100 and 200 EMAs (green and red lines) continue trending upward, reinforcing mid- and long-term bullish sentiment. However, failure to close above $122,500 in the coming sessions could expose Bitcoin to deeper retracements, with eyes on $118,000 as the next demand area.
The chart suggests a healthy consolidation phase after a major breakout. A decisive move above $123K would confirm renewed bullish momentum, while a breakdown below $120K could mark the beginning of a deeper correction phase.
Featured image from ChatGPT, chart from TradingView.com
Editorial Process for bitcoinist is centered on delivering thoroughly researched, accurate, and unbiased content. We uphold strict sourcing standards, and each page undergoes diligent review by our team of top technology experts and seasoned editors. This process ensures the integrity, relevance, and value of our content for our readers.