
Bitcoin is under pressure and struggling to peel back losses from early this week. Even with prices stabilizing in the last day, the path of least resistance is southwards for now. For the trend to shift, there must be a convincing close above the local resistance at around $66,000.
Bitcoin Active Addresses “Anemic”
Data points to a worrying drop in on-chain activity as prices cool off and consolidate within a bear breakout formation. Taking to X, one analyst observes that over the past few months, the number of Bitcoin active addresses has been falling. The only time this metric rose was from late 2023 through to early 2024.
Coinciding with this expansion and looking at price data, Bitcoin prices had risen from below $30,000 to as high as $73,800. Afterward, and referring to on-chain development, the number of active addresses has been sloping negatively.

Usually, a slowdown in network activity, as is the case at the moment, could have massive implications on price action. As historical price movement shows, the number of Bitcoin active addresses rises in tandem whenever prices are uptick. Prices are under pressure, and transfers from unique addresses have been falling, signaling decreasing interest from the masses.
Spot Bitcoin ETFs To Blame?
The analyst has picked out a possible explanation for this contraction. Looking at the Bitcoin active addresses trend, it is easy to note that activity fell in momentum when the United States Securities and Exchange Commission (SEC) approved the first batch of spot Bitcoin ETFs.
While the product allowed institutions to get exposure to the world’s most valuable coin, there was a marked shift in ownership dynamics.
Unlike in previous cycles, where prices were driven to fresh highs mostly due to retail activity and sentiment, prices were now in the hands of the “big boys” who could move millions in one swoop, moving prices.
Before, it could take many “small” addresses to move prices, explaining why, even when prices were depressed in the first half of 2023, activity was relatively higher than it is now.
If this is the trend, it is likely that as BTC shrinks, breaching key support levels, activity will further shrink as institutions and retailers shy away. The situation could worsen now that long-term holders have been moving coins in recent weeks.
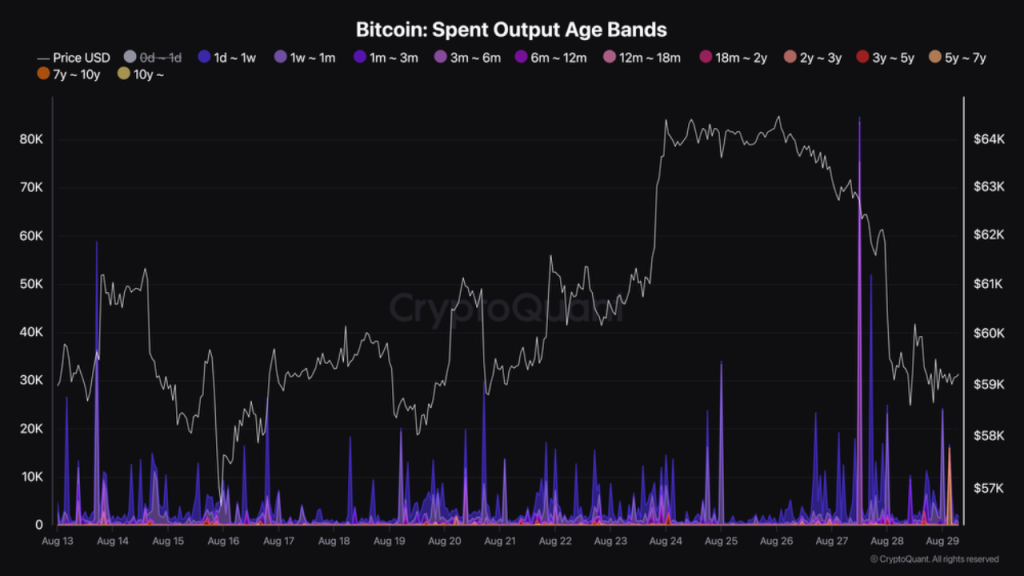
One analyst notes that 75,228 BTC aged between three to six months were moved on August 27 alone. Yesterday, on August 28, 1,614 BTC aged between 18 months and two years were transferred.
Feature image from Canva, chart from TradingView