

Both Bitcoin and Ethereum have extended their retracements into the past 24 hours, puncturing price thresholds that many technical analysts had deemed as important support levels. Bitcoin has slipped below $110,000, while Ethereum has also broken beneath the $4,000 price level.
The most recent correction questions the durability of the uptrend and whether this is a corrective pullback or the beginning of an extended downtrend. The charts of both assets, however, offer technical signals that point to the next direction for price action.
Bitcoin Is Testing Range Highs And Trend Anchors
Technical analysis laid out by TraderMercury on the social media platform X noted that Bitcoin is currently bouncing from the previous range highs, along with the 12-hour 200MAs trend. In other words, Bitcoin’s price action has dipped down to a confluence zone where resistance and the 200-period moving averages on the 12-hour timeframe converge. That zone is acting as a pivot. If buyers defend it, the correction may be contained. However, if they don’t, the downside could open further.
There are still signs of life and buyer interest around that region, which is positive in the short term. But the higher-timeframe outlook, as TraderMercury stated, is “dauntingly boring and choppy.” This is pointing to the Bitcoin price’s oscillation without strong directional conviction on mid and high frames. That means any breakout (up or down) could be a clearer signal of where momentum wants to take things next.
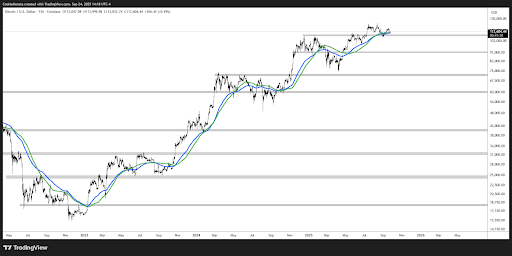
A notable red flag is if Bitcoin’s price begins to drift back inside the prior 8-month range below $108,000. That would indicate a failure of the breakout move that preceded it, and potentially signal a return to range dynamics or worse. The more bullish scenario is that Bitcoin carves out a move away from that range. Until then, the 12-hour and daily moving averages, plus the prior horizontal pivots around $108,000 to $111,000, will all act as tension zones to monitor.
Ethereum Maintains Favorable Context On Higher Timeframes
Despite breaking below $4,000, Ethereum has steadily maintained above a 4-year range. However, the most recent downtrend means that it has lost the 200MAs on the 4-hour candlestick timeframe chart. According to TraderMercury, this is an objective weakness that has been seen only one other time in the past five months.
However, this weakness doesn’t translate into a full-blown bearish narrative. Ethereum’s price action lost the same trend back in May, only for it to carve out a higher low on the weekly and resume upward movement into new highs. Therefore, the market only becomes dangerous for ETH if its price breaks below $3,900. That’s a threshold TraderMercury flagged as a point of no return for the current setup.
Until then, a reclaim of major higher averages on the daily to weekly timeframe, for instance, would act as a clean risk-on bullish signal if it happens soon.
$3,900 is the line in the sand for Ethereum. A bounce is always possible if it can hold above that and begin to re-engage with multi-month moving averages. If that fails, deeper support could come into play around $3,600.
At the time of writing, Bitcoin is trading at $109,600, and Ethereum is trading at $3,940.
Featured image from Pixabay, chart from Tradingview.com
Editorial Process for bitcoinist is centered on delivering thoroughly researched, accurate, and unbiased content. We uphold strict sourcing standards, and each page undergoes diligent review by our team of top technology experts and seasoned editors. This process ensures the integrity, relevance, and value of our content for our readers.