Bitcoin (BTC) is under significant pressure after experiencing a substantial 14% retrace from $65,103 to $55,602. This downturn is occurring amidst a climate of fear and uncertainty impacting both the cryptocurrency and US stock markets.
Recent data from Santiment highlights a notable shift: Bitcoin is becoming progressively less sensitive to fluctuations in equities. This suggests that while both markets grapple with volatility, their interactions may not be as intertwined.
As we move forward, price action might be influenced more by its market dynamics rather than broader stock market trends. This shift could mean that, despite ongoing volatility, the fundamental correlation between US stocks and BTC might diminish, leading to a period where BTC’s movements are increasingly driven by internal factors rather than external market influences.
Bitcoin Correlation With Stocks Changes
Yesterday, the US stock market faced a challenging day, with the S&P 500 recording its third worst-performing day of 2024. According to a report from Santiment shared on X, the S&P 500 dropped by 2.16%, reflecting ongoing market struggles.
In contrast, BTC experienced a relatively mild decline of 1.82%. This contrasts sharply with BTC’s more severe drop during the August 4th market turmoil, when the S&P 500 plummeted by 3.00% and BTC fell by 7.16%.
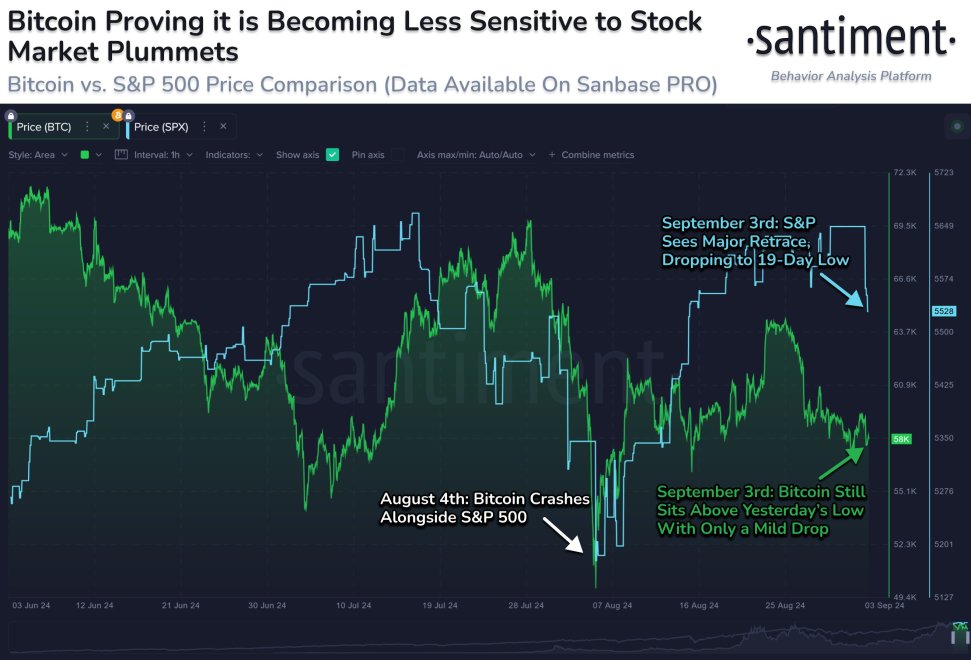
Santiment’s recent chart reveals an intriguing shift in Bitcoin’s correlation with the stock market. Previously, BTC’s correlation with equities had fluctuated from negative to positive and is now approaching a neutral stance.
This evolving dynamic suggests that BTC is becoming less sensitive to movements in the stock market. Such a shift indicates a potential strength for BTC, as it demonstrates resilience against broader market pressures.
If this trend continues, it could signal a period where Bitcoin’s price movements are driven more by its market factors rather than by fluctuations in the stock market. This could lead to a potential recovery for Bitcoin, regardless of ongoing volatility in equities.
Investors might interpret this as a positive sign, suggesting that Bitcoin could decouple from traditional market influences and pave the way for more independent price actions in the future.
BTC Price Action Driven By Uncertainty
Bitcoin (BTC) is trading at $56,531 after setting a new weekly low of $55,602. As the price continues its downward push, bulls must prioritize a recovery above the 4-hour 200 moving average (MA), which is $59,684.
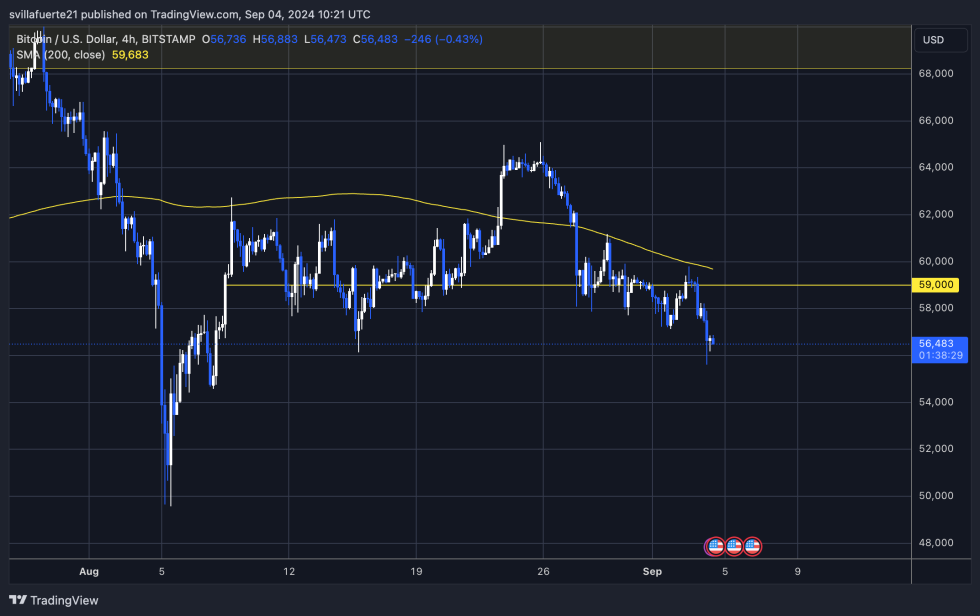
This moving average has proven to be a significant short-term resistance level over the past month. Reclaiming the $60,000 psychological level would be crucial in reversing the current negative sentiment and attracting liquidity to shift the trend positively.
However, if BTC fails to close above $56,000, it risks a further decline. In such a scenario, the next support level to watch would be $54,568. Failing to hold above this level could lead to more bearish pressure and test even lower levels.
Monitoring these key levels will be essential for determining the next direction for Bitcoin. The market’s ability to reclaim and sustain levels above these technical indicators will be critical in shifting the current trend and restoring bullish momentum.
Featured image from Dall-E, chart from TradingView