
Bitcoin is at a crucial point after several days of recovery and consolidation. On August 5, it experienced a sharp capitulation event, with the price dropping to a monthly low of $49,577. While some investors remain skeptical, believing Bitcoin hasn’t reached its bottom yet, key data from CryptoQuant suggests that the worst might be over.
The broader market is now focused on the Federal Reserve’s upcoming decision on interest rates, which could have a significant impact on Bitcoin’s price trajectory. Investors are cautiously waiting to see if this week’s announcement will bring more certainty to the market. A favorable decision could act as a catalyst for Bitcoin’s upward movement, pushing it past resistance levels.
However, the risk of further downside remains if Bitcoin fails to reclaim higher price levels in the near term. Breaking above key resistance around $60,000 will be critical for regaining bullish momentum.
Bitcoin Downtrend Coming To An End
Bitcoin is currently trading just below $60,000, reflecting a period of recovery from recent local lows. This positive price action has sparked optimism among investors, who are beginning to believe that the prolonged series of corrections that started in March may be drawing to a close.
Analysts, including top experts, have suggested that the bottom was likely reached on August 5, marking a potential turning point for Bitcoin. One notable CryptoQuant analyst, Axel Adler, a specialist in on-chain and macro research, has shared insightful data on X indicating that Bitcoin might have indeed bottomed.
The analyst’s chart reveals a significant decrease in the Mayer Multiple, from 1.82 for $73,000 to 0.9 points. A further decline to 0.7 points would confirm a local bottom. This indicator has historically been used to identify market bottoms and potential reversal points.

A climate of fear and uncertainty has characterized the recent price action, but this sentiment is starting to shift. On September 15, the Fear and Greed Index showed a neutral level for the first time since August 26, signaling a potential stabilization in market sentiment.
As Bitcoin trades near $60,000 and shows signs of recovery, the market is beginning to adjust its outlook, suggesting that the worst of the corrections might be behind us and that a new phase of growth could be on the horizon.
BTC Technical Levels To Watch
Bitcoin (BTC) is currently trading at $59,003 after a small 5% dip from last Friday’s local high. The price is facing resistance as it struggled to close above the 4-hour 200 exponential moving average (EMA) at $58,848, testing this level from below. This EMA is a key indicator of short-term market strength, and reclaiming it would be essential for BTC to regain momentum.
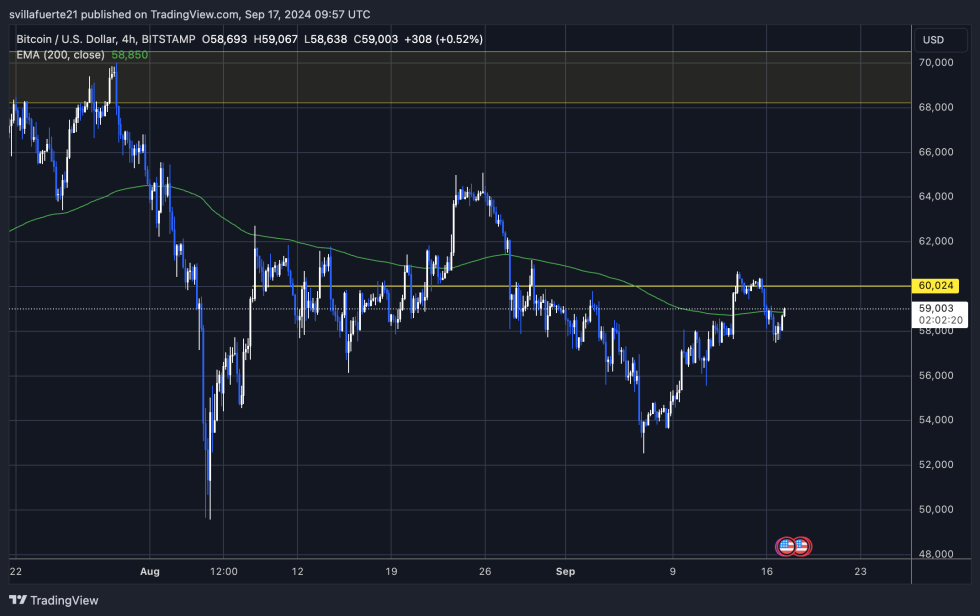
For bulls to challenge the current market structure, BTC must break above the $60,000 mark, a psychological level that could trigger significant buying pressure if cleared with conviction. A strong move above this level would signal a renewed uptrend, encouraging more investors to enter the market.
However, if BTC fails to close above the 4H 200 EMA, a deeper correction may follow. The price would likely target $55,500, a key demand level where buyers could step in to find support. This level is crucial as it could trigger a change of structure, defining Bitcoin’s long-term price direction.
Featured image from Dall-E, chart from TradingView