
Bitcoin (BTC) is currently trading below $60,000 after experiencing a volatile period and a notable 11% correction from last Sunday’s peak of $65,103. This sharp decline reflects the heightened uncertainty and fear permeating the market.
Recent key data from Glassnode reveals a concerning slowdown in net capital inflows for BTC, signaling a potential shift in investor sentiment. The decrease in inflows underscores the market’s current fragility and the growing caution among traders. Coupled with the recent price swings and market turbulence, this data suggests that Bitcoin’s journey through this volatile phase is far from over.
As BTC continues to navigate these challenging conditions, the risk of further fluctuations remains significant, leaving investors to brace for more potential upheaval in the short term.
Bitcoin Market Equilibrium is Reached
Crucial data from Glassnode indicates a slowdown in net capital inflows into Bitcoin, suggesting that a degree of equilibrium has been reached between investors taking profits and those facing losses.
Historically, capital inflows into the Bitcoin market are rarely as subdued as they are now; 89% of days typically see higher inflows than those observed today, except during periods dominated by significant losses in bear markets. This current phase of inactivity is noteworthy as it often precedes substantial increases in market volatility.
The Realized Cap, a key metric for understanding Bitcoin’s market value, remains at an all-time high (ATH) of $619 billion, bolstered by a substantial net inflow of $217 billion since Bitcoin’s low of $15,000 in December 2022.
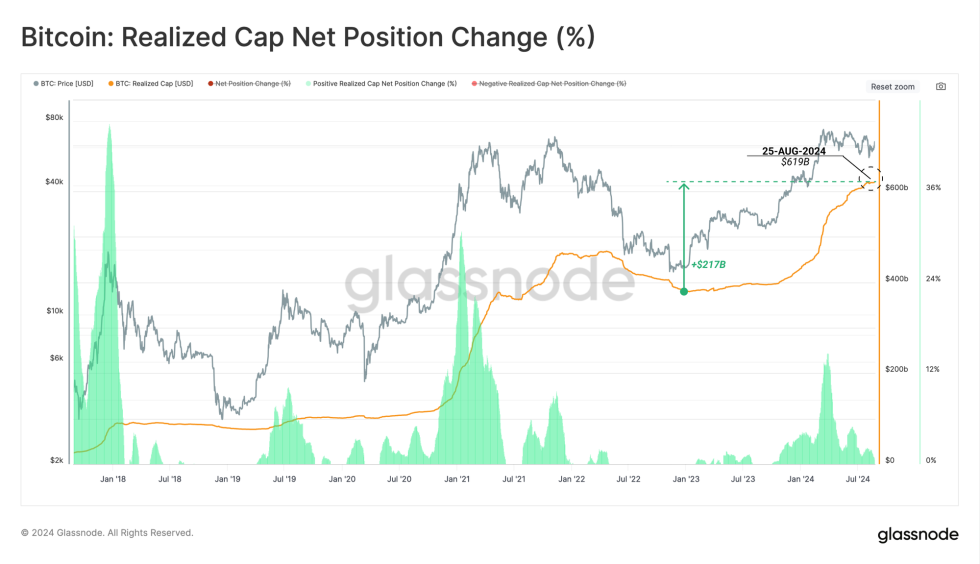
Despite the prevailing negative sentiment and recent market turbulence, these indicators reveal that there is still potential for growth. The impressive Realized Cap and robust net inflows suggest that, while the market is experiencing a quietude phase, this may set the stage for an upcoming uptrend.
As Bitcoin continues to navigate through this period of reduced inflows and investor hesitation, the groundwork for a potential resurgence and increased volatility appears to be forming, offering hope for a positive shift in the market’s trajectory as the year progresses.
BTC Trading At Crucial Level
Bitcoin (BTC) trades at $59,541 when writing, following three days of intense price volatility. On the 4-hour chart, BTC has faced a clear rejection from the 4-hour 200 exponential moving average (EMA), a crucial resistance level that has consistently hindered price progress in recent weeks. Since the decline observed on Tuesday, Bitcoin’s price has been oscillating between $57,866 and $61,182, creating a range that could build liquidity for a significant move.

If BTC successfully breaks above the 4-hour 200 EMA, it could pave the way for a rally toward $65,000. This breakout would signal a bullish shift, potentially leading to a substantial upward momentum.
However, if Bitcoin fails to overcome this resistance, it may test the next support level at $56,138. This level could become critical in determining whether the current range-bound phase will continue or if a deeper correction is imminent.
Monitoring BTC’s ability to navigate these key technical levels will be essential in forecasting its near-term price direction and potential for future movement.
Cover image from Dall-E, Charts from Tradingview