
On-chain data shows Bitcoin has been moving to Coinbase from other exchanges. Here’s what this has historically meant for the asset.
Bitcoin Coinbase Flow Pulse Has Turned Back Green Recently
As explained by CryptoQuant author Axel Adler Jr in a new post on X, Coinbase has resumed inflows from other exchanges recently. The indicator of relevance here is the “Coinbase Flow Pulse,” which keeps track of the net amount of Bitcoin flowing between Coinbase and the other cryptocurrency exchanges.
Below is the chart shared by the analyst that shows the trend in the 7-day moving average (MA) of this indicator over the last few years.
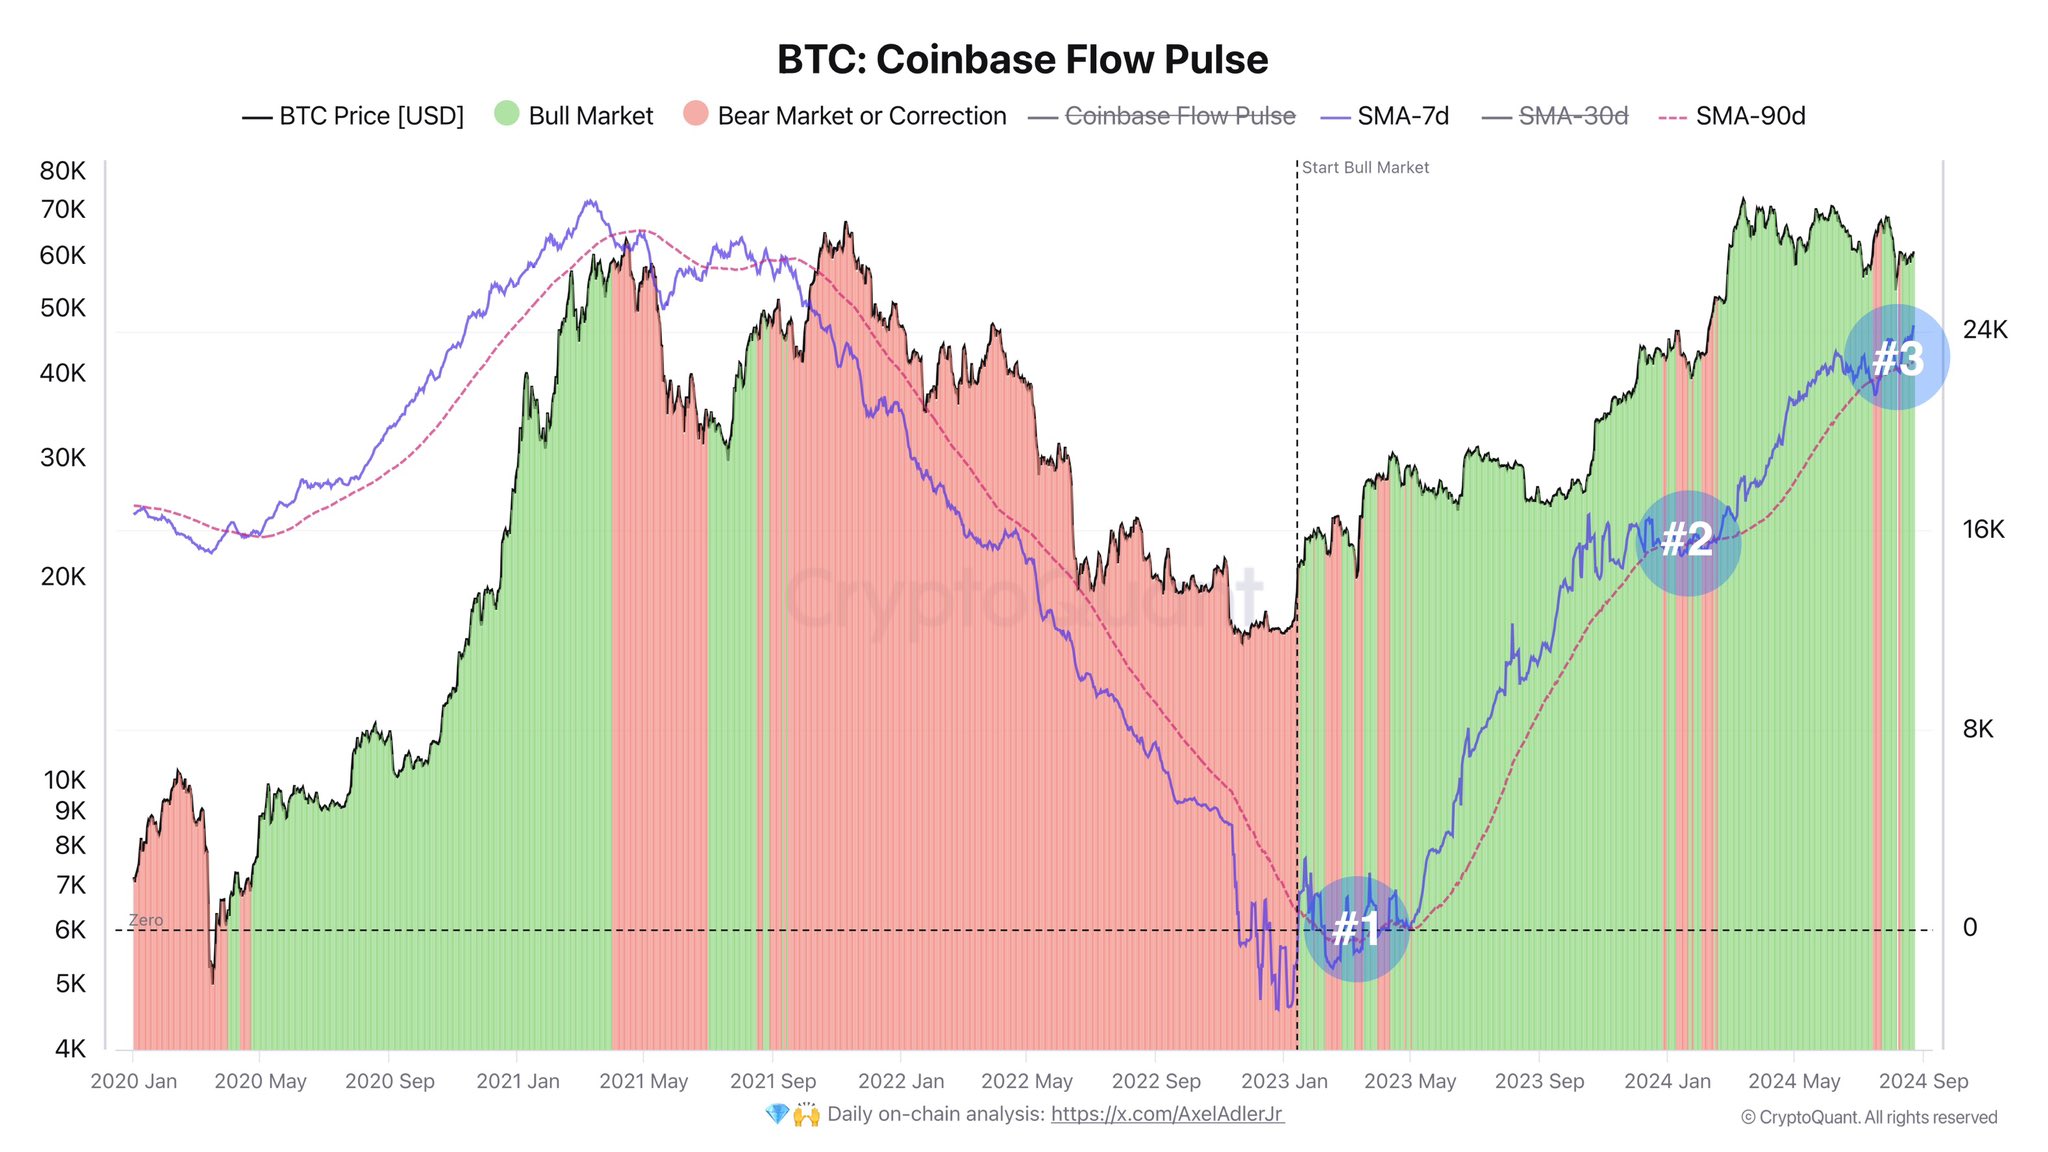
Looks like the value of the metric has been heading up in recent days | Source: @AxelAdlerJr on X
As is visible in the graph, the Bitcoin Coinbase Flow Pulse has been positive since mid-2023, meaning that Coinbase has been receiving net inflows from the other centralized exchanges.
However, the indicator’s trend about its 90-day MA is more relevant, however, shown in the same chart. The analyst has defined two zones for BTC based on where the 7-day MA is compared to this long-term MA.
When the 7-day MA crosses under the 90-day MA, BTC will likely display bearish action, so periods like this are categorized as “Bear Market or Correction” (highlighted in red). Similarly, the metric above this line implies “Bull Market” (green).
From the graph, it’s apparent that the 7-day MA of the Coinbase Flow Pulse had fallen under the 90-day MA just earlier, but now, the two have crossed back, implying that demand for shifting coins to Coinbase has picked back up.
The last time this pattern formed for the cryptocurrency was just before the rally towards the new all-time high (ATH). Thus, this signal may also be bullish for the price this time.
As for why Coinbase may be relevant in this manner for the asset, the answer may lie in the fact that the platform is the known destination of American institutional entities. As such, a flow of coins from other exchanges into Coinbase could imply demand from these US-based whales.
While the market outlook appears positive from the perspective of the Coinbase Flow Pulse, another indicator from the on-chain analytics firm CryptoQuant may not be so bright.
As CryptoQuant Head of Research Julio Moreno has explained in an X post, Bitcoin demand is still muted when considering the “Apparent Demand” metric, which strives to estimate the demand present in the entire market and not just a section of it like the Coinbase Flow Pulse.
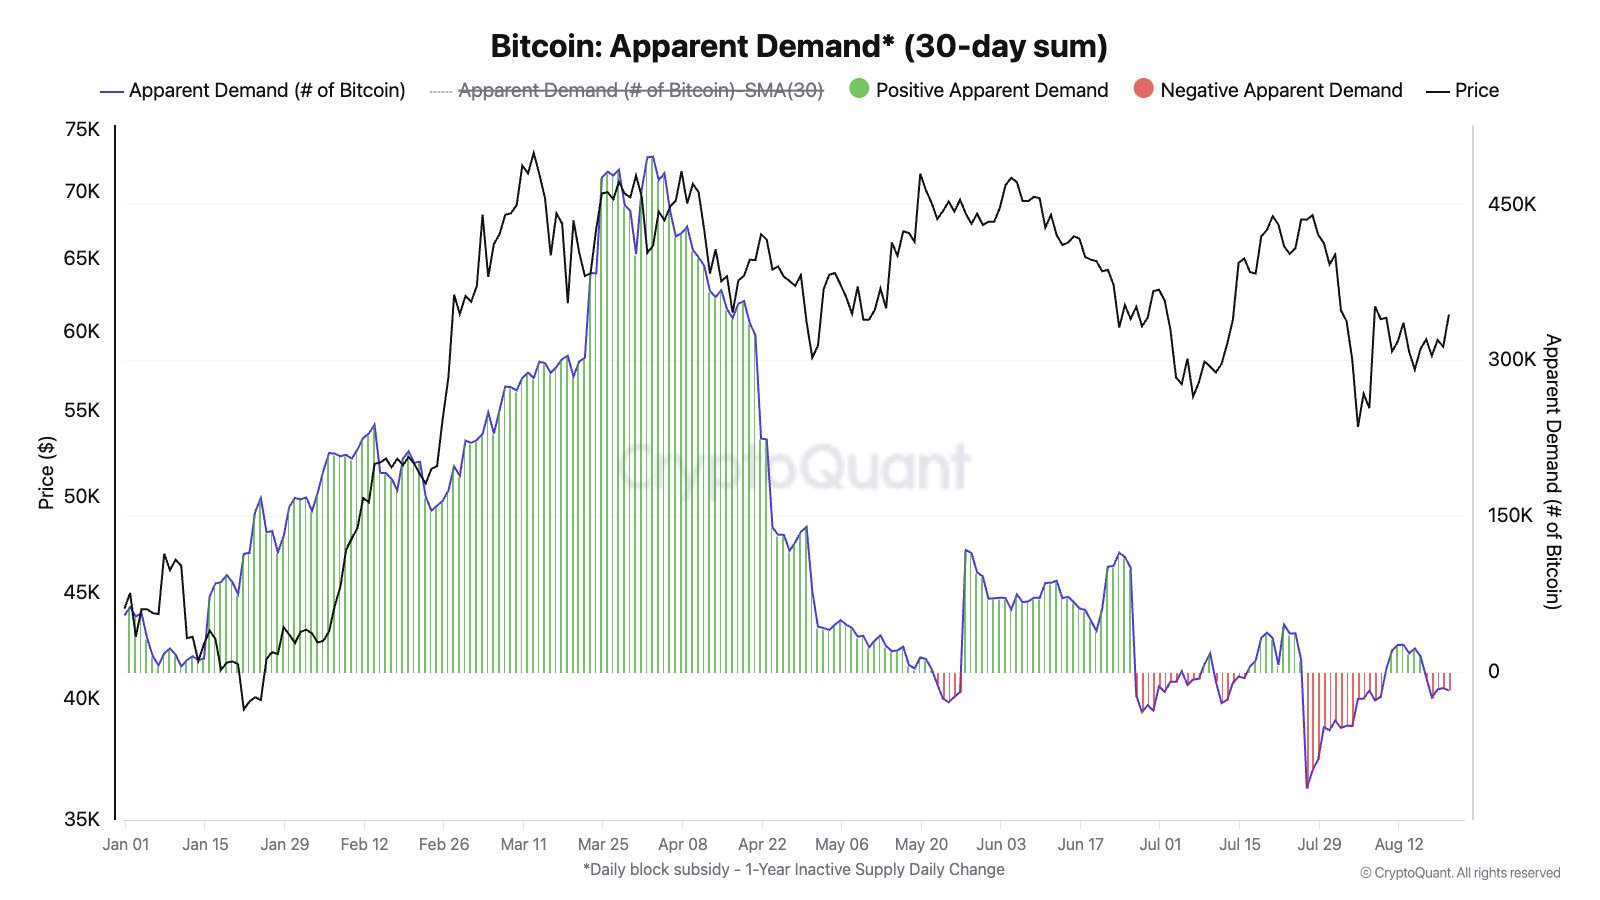
The value of the metric appears to have been neutral recently | Source: @jjcmoreno on X
Whereas the demand for Bitcoin was at significant levels earlier in the year, it seems to have fallen off hard after the long consolidation streak, as the Apparent Demand is currently at more or less neutral values.
BTC Price
At the time of writing, Bitcoin is trading at around $61,000, up over 5% in the past week.
The price of the coin seems to be slowly making its way up | Source: BTCUSD on TradingView
Featured image from Dall-E, CryptoQuant.com, chart from TradingView.com