
Bitcoin futures are navigating a shaky short-term setup today. After a quick bounce from $63,260 stalled right around the $64,000 mark, sellers stepped right back into the driver’s seat. While the immediate outlook leans bearish, BTC is hovering near crucial support levels that could dictate its next big swing.
Before diving into the chart technicals, it is worth looking at the broader macro backdrop driving global markets today:
Key Takeaways for Bitcoin Traders Today
If you are actively trading or holding BTC, here is the quick snapshot of where things stand right now:
- Current Bias: Bearish repair phase (not a confirmed bullish reversal yet).
- Prediction Score: -4 / +10 (indicates a moderate bearish advantage with medium confidence).
- Bullish Trigger: Sustained acceptance above $64,100.
- Bearish Trigger: Sustained trading below $63,580.
- Immediate Support Zone: $63,260 – $63,300 (where buyers previously stepped in).
- Execution Risk: Shorting straight into major support carries a poor risk-to-reward ratio. Waiting for a failed rebound or confirmed breakdown is generally a safer play.
Note: This analysis is based on Bitcoin futures. Spot prices, perpetual swaps, and CFDs may trade at slight variances, so be sure to calibrate these zones to your specific trading platform.
What Is Happening to Bitcoin Right Now?
Bitcoin has been under noticeable pressure following two heavy selling waves that knocked futures down from roughly $65,545 to a low of $63,260.
The initial recovery effort off that bottom looked promising, bringing prices up to $63,995 while briefly rebuilding volume at higher levels. However, buyers simply couldn’t hold ground above the psychological $64,000 mark.
This rejection is a classic example of buyer absorption. Aggressive buyers were actively picking up available sell orders, but because larger sellers were dumping heavy supply into that demand, price couldn’t move higher and eventually closed near the bottom of the move. Buying activity alone isn’t bullish—it has to actually hold the price up to count.
Because it failed to hold, BTC slipped below its developing value area, pulling back toward the $63,695 level and making the overnight rally look more like a failed attempt at a fix than a true trend reversal.
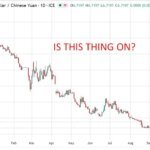
On the BTCUSD 1 hour chart, I’m also watching this potential channel, and especially if price decides to cross over its (red) mid line
Why the Failed $64,000 Breakout Matters
The $63,935 to $64,100 zone has now transformed into the most critical resistance level on the chart.
Because Bitcoin already tagged $63,995, a quick pop back above $64,000 won’t necessarily mean buyers are back in charge. Major round numbers frequently attract liquidity sweeps and stop runs before price falls back into its old range.
That is why the true bullish confirmation threshold is set slightly higher at $64,100—just above the previous value-area high.
To confirm genuine price “acceptance” above this level, traders typically look for:
- Price holding above $64,100 for an extended period
- Full 30-minute or 1-hour candles closing above the zone
- A clean breakout followed by a successful retest of support
- Stronger buying volume following the breakout
What Would Turn the Bitcoin Outlook Bullish?
The first sign of structural improvement would be a move back above the fair-value cluster between $63,765 and $63,825. This would pull BTC back over its value-area low and high-volume node.
However, clearing that hurdle alone isn’t enough to kill the bearish trend. Buyers still need to clear $64,100. If they succeed, the primary upside targets for resistance or profit-taking include:
- $64,240
- $64,430 – $64,480
- $64,580
- $64,930 – $64,980
The final target zone sits just under the critical $65,000 resistance block where the recent breakdown first gained momentum.
What Would Make the Outlook More Bearish?
Trading below $63,765 serves as an early warning sign that the recovery is losing steam, but the official bearish activation level sits at $63,580.
How you approach this depends on your trading style:
- Aggressive Traders: May look at weakness below $63,765 as an early clue to position short.
- Conservative Traders: Will likely wait for a confirmed breakdown below $63,580 (under both the overnight low and point of control). This sacrifices entry price in exchange for a higher probability trade.
If sellers manage to push and hold price below $63,580, the primary downside target levels are:
- $63,420 – $63,380
- $63,260 – $63,300 (Major Support)
- $63,050
- $62,820 (if panic selling accelerates)
Bitcoin Support & Resistance Reference Table
| Bitcoin Futures Level | Market Interpretation |
|---|---|
| Above $64,100 | Bullish recovery gains real momentum |
| $63,935 – $64,100 | Failed breakout & primary resistance zone |
| $63,765 – $63,825 | Fair-value cluster buyers need to reclaim |
| Around $63,600 | Immediate intraday pivot point |
| Below $63,580 | Bearish continuation scenario triggers |
| $63,260 – $63,300 | Major support; main test for buyers |
| Below $63,260 | Opens the door down toward $63,050 and $62,820 |
Trading Scenarios: Bullish vs. Bearish
| Scenario | Activation Level | Target Areas | Invalidation Signal |
|---|---|---|---|
| Bullish | Acceptance above $64,100 | $64,240, $64,480, $64,580, $64,980 | Price falling back inside the breakout zone |
| Bearish | Acceptance below $63,580 | $63,380, $63,260, $63,050, $62,820 | Reclaiming $63,825 followed by a push above $64,000 |
The space between $63,580 and $64,100 is effectively a “decision zone.” Price can chop around aggressively within this range, but neither buyers nor sellers have fully established control until a boundary breaks.
Understanding the -4 Bitcoin Score
The -4 score out of +10 reflects a modest advantage for sellers, not an absolute guarantee that Bitcoin is going to crash immediately.
The failed attempt at $64,000 and the loss of short-term value support this soft bearish bias. However, the score isn’t more negative because the bounce off $63,260 showed real buying interest, and sellers haven’t managed to crack that support floor yet.
Final Takeaway for Traders
The main takeaway from today’s price action is simple: never trust high buying volume in isolation. Aggressive buying only matters if it actually pushes price higher. When buyers are active but the market continues closing near its lows, it usually signals that heavy institutional supply is soaking up that demand.
Avoid chasing shorts directly into the major $63,260 support floor. Waiting for a failed bounce into resistance or a clean, confirmed break below $63,580 offers a much better risk-to-reward setup.
Disclaimer: Crypto trading carries significant risk. Always use proper risk management, set stop losses, and trade according to your personal strategy