
According to the latest on-chain observation, the Bitcoin traders’ realized losses have reached a level that has proven critical to the coin’s movement multiple times in recent years. This begs the question — is the Bitcoin price bottoming out?
Traders’ Realized Losses Below -12 Again — What Happened Last Time?
In a recent post on the X platform, prominent crypto analyst Ali Martinez pointed out that the amount of losses being realized by Bitcoin traders has been increasing in recent weeks. This on-chain revelation is based on the CryptoQuant Profit/Loss Margin metric, which aggregates profits and losses from all Bitcoin transactions.
The Profit/Loss Margin basically assesses the overall profitability of investors of a particular cryptocurrency (Bitcoin, in this scenario). When the metric’s value is positive, it implies that more BTC is being sold at a profit. A negative Profit/Loss Margin, on the other hand, indicates that more Bitcoin is being sold at a loss.
According to data from CryptoQuant, the Profit/Loss Margin is currently beneath the -12 mark, meaning that traders are realizing more losses than gains in the market at the moment. Historically, this level is more significant, considering that the metric has been below the -12 mark in the past cycles.
Interestingly, the recent times in which the Profit/Loss Margin has fallen below -12 has been followed by periods of significant bullish price action. As shown in the chart and highlighted by Martinez, the last two times the metric fell beneath this level were marked by 104% and 193% price rallies, respectively.
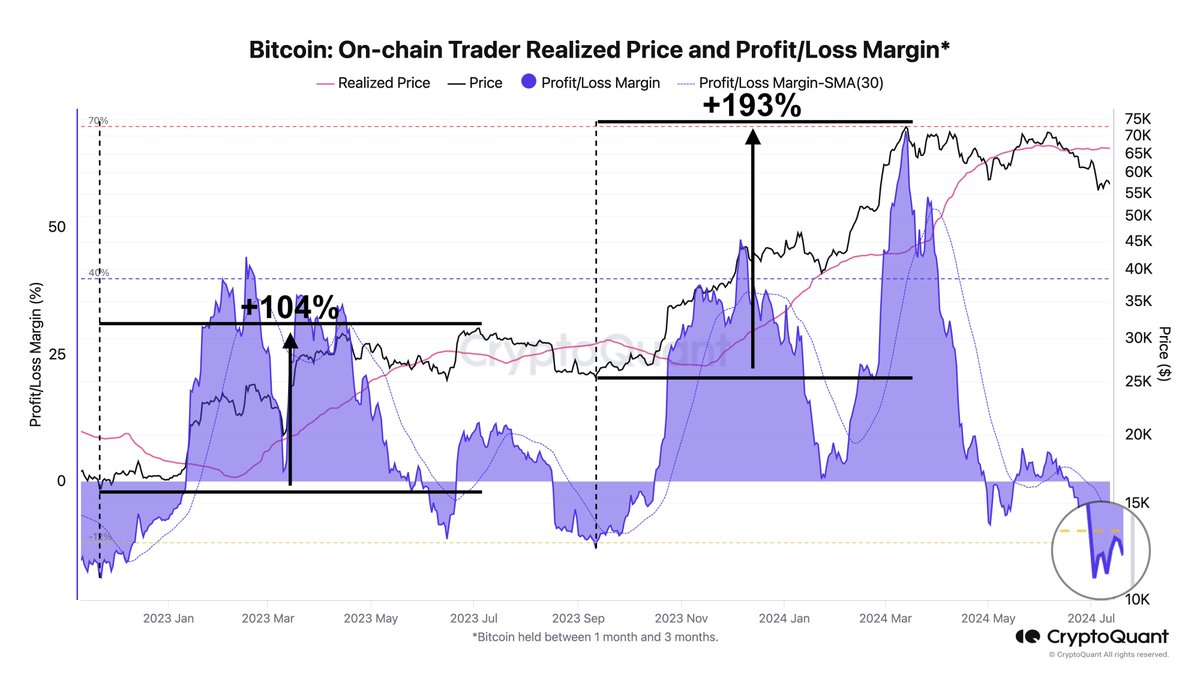
Source: Ali_charts/X
If this historical pattern is anything to go by, then there is a likelihood that the price of Bitcoin might experience notable bullish activity in the near future. Moreover, observation of significant losses in the market can suggest the bottom of a bearish cycle and the start of a more positive phase.
Bitcoin Price To Surge? Here Are Important Levels To Watch
If the historical pattern does hold true and the Bitcoin price goes on a rally, there are a couple of price zones to watch out for. According to Martinez, the premier cryptocurrency has major resistance levels around the $61,340 and $64,620 zones.
This revelation is based on the cost basis of Bitcoin investors and the distribution of the BTC supply across various price ranges. The size of the dots in the chart below reflects the strength of the resistance and support and the amount of BTC purchased at each price zone.
Key resistance levels for #Bitcoin to monitor are $61,340 and $64,620. The crucial support level to watch is $57,670! pic.twitter.com/YrBPkJmWzn
— Ali (@ali_charts) July 13, 2024
As of this writing, the price of Bitcoin stands around $59,467, reflecting a 2.7% increase in the last 24 hours. According to CoinGecko data, the flagship cryptocurrency is up by 2% in the past week.
The price of BTC on the daily timeframe | Source: BTCUSDT chart on TradingView
Featured image from Pexels, chart from TradingView