Data shows the Bitcoin Fear & Greed Index is right outside the entrance of the extreme greed territory after the latest crash in BTC’s price.
Bitcoin Fear & Greed Index Is Currently Deep Into The Fear Region
The “Fear & Greed Index” is an indicator devised by Alternative that basically tells us about the sentiment the average trader holds towards the Bitcoin and wider cryptocurrency market right now.
This indicator determines the sentiment using data of the following five factors: volatility, trading volume, social media sentiment, market cap dominance, and Google Trends.
To represent this mentality, it makes use of a simple scale that runs from zero to hundred. All values above the 53 mark imply the presence of greed among the investors, while those under 47 suggest fear in the market. The region in-between these two thresholds corresponds to neutral sentiment.
Now, here is what the Bitcoin Fear & Greed Index is currently looking like:

The value of the metric appears to be 26 at the moment | Source: Alternative
As is visible above, the Bitcoin Fear & Greed Index has a value of 26 right now, which suggests the market is deep into the fear territory. In fact, this level is nearly deep enough to qualify for a special zone called extreme fear.
Extreme fear occurs when the index dips under 25 and corresponds to intense bearish sentiment in the market. There is a similar zone for the greed side, called extreme greed, which takes place above 75.
Interestingly, only a week ago, the Bitcoin market was sitting on the verge of the latter region, but it is now already on the opposite end of the spectrum, as the below chart shows.
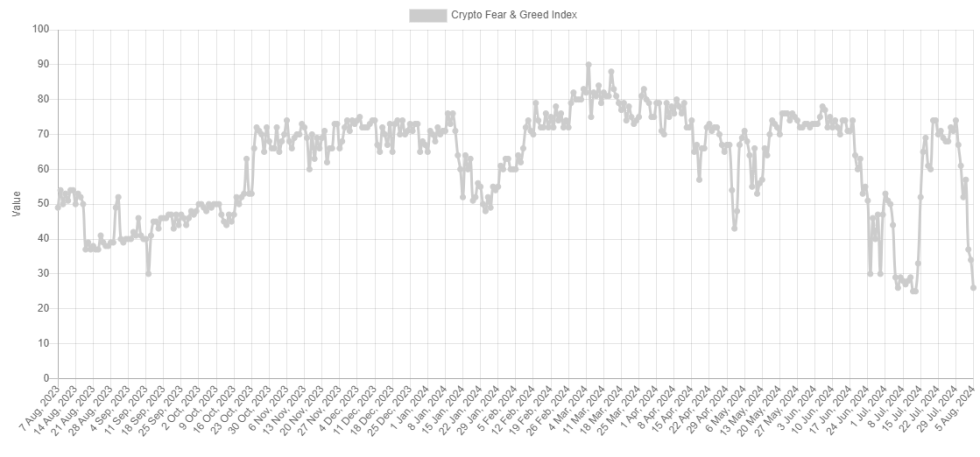
Looks like the value of the index has seen a steep drop in recent days | Source: Alternative
The reason behind this sharp change in market sentiment is naturally the bearish trajectory BTC has followed over the past week, including the crash that has occurred during the last 24 hours.
From the chart, it’s apparent, though, that the greedy market sentiment towards the end of July was only reached after a similar sharp reversal in the indicator from fear levels similar to now.
Those lows in the metric in the first half of July had marked a bottom for the asset and as it has turned out, the nearly extremely greedy values at the end of the month had made a top.
This pattern is actually something that has historically been witnessed; Bitcoin has tended to move in the direction opposite to what the crowd expects. These contrary moves have usually been the most probable inside the extreme zones, as the market expectation is the strongest in them.
Given that the last couple of reversals occurred just outside these zones, though, it’s possible another one could happen for the cryptocurrency at the current nearly extremely fearful level as well.
It now remains to be seen how the sentiment among the Bitcoin investors develops in the coming days and if a drop into the extreme fear zone will happen.
BTC Price
Since the drawdown under $50,000, Bitcoin has shown some recovery as its price is now trading around $54,800.
The price of the coin appears to have shown a bounce since its low | Source: BTCUSD on TradingView
Featured image from Dall-E, Alternative.me, chart from TradingView.com