

Bitcoin has failed to reclaim higher prices, reinforcing the growing belief that the market may be entering a deeper bearish phase. After multiple attempts to push above key resistance levels, BTC continues to trade sideways with declining momentum, reflecting a clear shift in investor sentiment. Fear is rising across the market, and price action has yet to show any convincing signs of recovery.
According to new data shared by Axel Adler, several structural on-chain and market indicators now support a continuation of bearish conditions in the months ahead. Adler’s analysis points to weakening demand, persistent sell pressure, and deteriorating liquidity—factors that historically precede prolonged corrective periods.
While Bitcoin has held above critical support zones, its inability to establish higher highs or sustain rebounds suggests that buyers remain cautious and largely defensive.
Moreover, broader market conditions show similar fragility, with derivatives positioning, stablecoin flows, and long-term holder behavior all signaling reduced conviction. This confluence of factors strengthens the bearish thesis and implies that volatility could intensify before the market finds a meaningful bottom.
Bitcoin MVRV Spread Signals a Deep Bear Phase
Adler’s analysis highlights one of the clearest structural indicators pointing toward sustained bearish conditions: the Bitcoin MVRV Z-Score Bull vs. Bear Market model. Specifically, he notes that the 30-day to 365-day MVRV spread is deeply negative and continues to deteriorate.
This spread measures the difference in profitability between short-term and long-term holders, and when the short-term cohort is underperforming significantly, it traditionally signals risk aversion, exhaustion, and weakening demand.
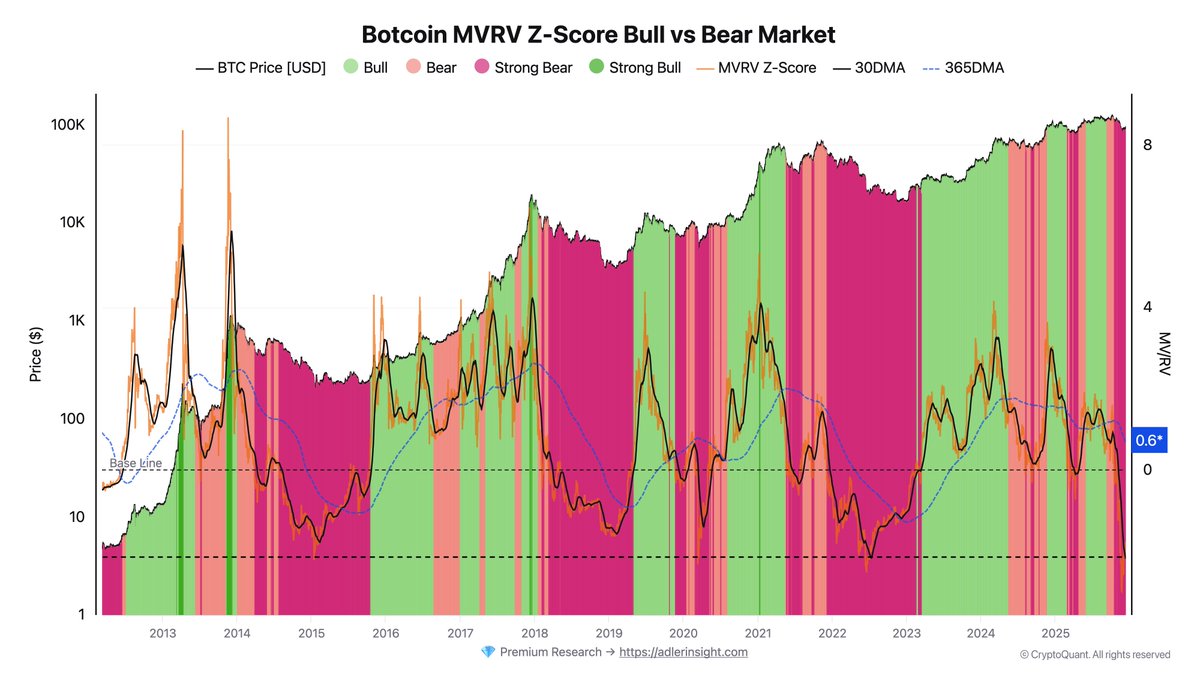
A crossover—when the 30-day MVRV rises above the 365-day metric—has historically marked the transition from bear markets into new bullish phases. However, Adler stresses that such a crossover does not appear imminent under current conditions. The spread remains far below the threshold required for a structural reversal, reinforcing the view that Bitcoin is still entrenched in a deep bear phase within this model’s framework.
Cycle analogs further support this interpretation. Reviewing past market cycles, Adler estimates that the next likely window for a meaningful crossover sits in the second half of 2026. This implies that even if short-term rallies occur, they are more likely to be counter-trend bounces rather than the early stages of a sustainable bull market. Until the MVRV structure improves, broader sentiment may remain decisively bearish.
Price Struggles to Recover Momentum
Bitcoin continues to move sideways, reflecting a market that remains indecisive and structurally weak. The chart shows BTC trading near $92,000 after its sharp decline from the $120,000 region, with recent candles forming a tight consolidation range. This behavior typically signals a temporary stabilization phase rather than a confirmed reversal, especially given the broader bearish context highlighted by on-chain and macro indicators.
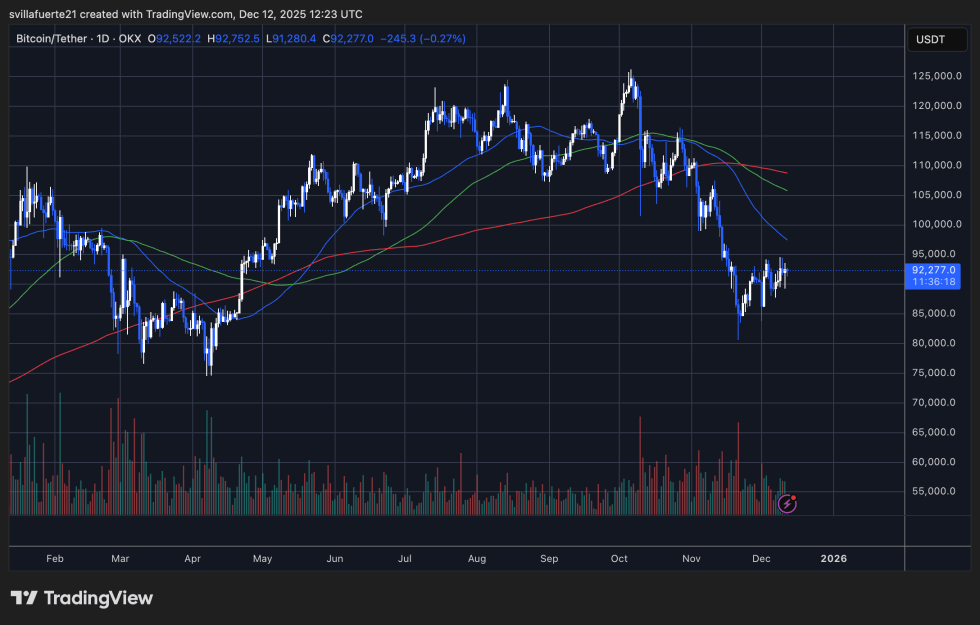
The 50-day moving average sits well above the current price, acting as dynamic resistance and indicating that short-term momentum remains firmly bearish. Likewise, the 100-day and 200-day moving averages trend downward, creating a compression zone that BTC has yet to challenge. Until Bitcoin can reclaim these levels with conviction, rallies may continue to be faded by sellers.
Despite the small rebound from sub-$90,000 levels, buying activity remains muted compared to the heavy sell volume that drove the initial breakdown. This suggests that demand is insufficient to absorb higher-timeframe selling pressure.
Structurally, Bitcoin is forming lower highs and lower lows across the daily timeframe, reinforcing a downtrend. A decisive break below $90,000 would expose deeper liquidity zones near $86,000–$84,000. Conversely, reclaiming $96,000 would be the first sign of strength—but current price action shows no such momentum yet.
Featured image from ChatGPT, chart from TradingView.com
Editorial Process for bitcoinist is centered on delivering thoroughly researched, accurate, and unbiased content. We uphold strict sourcing standards, and each page undergoes diligent review by our team of top technology experts and seasoned editors. This process ensures the integrity, relevance, and value of our content for our readers.