Fundamental
Overview
Bitcoin eventually managed
to break above the key 67275 resistance as the risk mood improved in the latter
part of last week. From a macro perspective, nothing has changed as the Fed is
going to cut into resilient growth, which should ultimately be a strong bullish
driver for the market.
Over the weekend, Trump delivered
some positive remarks on Bitcoin as he continues to double down on his
support for the crypto industry. As a reminder, Bitcoin rallied strongly from
the lows after the failed attempt to assassinate Trump. The market reacted positively to the event because his odds of winning the election
soared.
Moreover, the two main
bearish drivers that we had at the beginning of the month have been gone as the German
government finally offloaded all of its Bitcoin holdings on July 12th
and the old crypto exchange Mt. Gox has been repaying its old clients since the
first week of July.
Bitcoin
Technical Analysis – Daily Timeframe
Bitcoin Daily
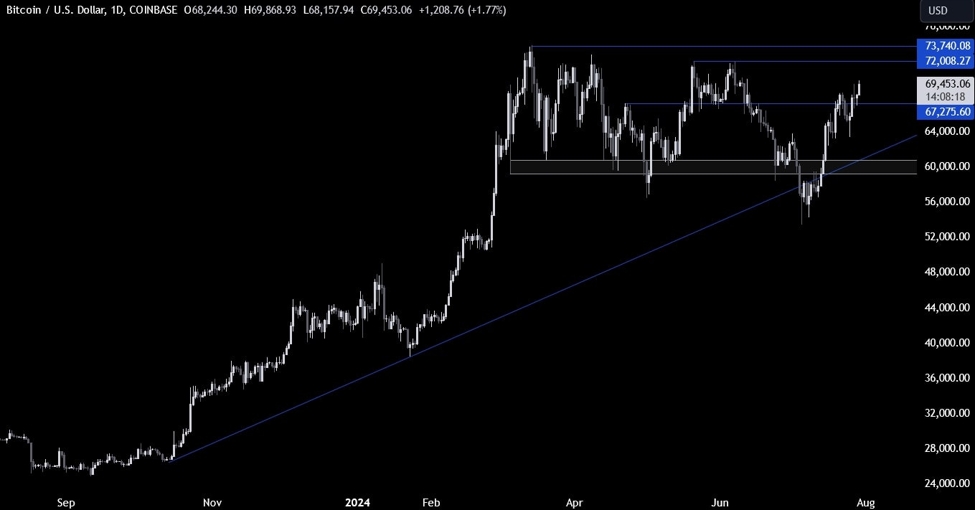
On the daily chart, we can
see that Bitcoin eventually managed to break above the key 67.275 resistance. The buyers should now have even
more confidence to pile in for a new all-time high. The sellers, on the other
hand, will want to see the price falling back below the 67.275 level to regain
some control and start targeting a drop into the 64000 level.
Bitcoin Technical
Analysis – 4 hour Timeframe
Bitcoin 4 hour
On the 4 hour chart, we can
see more clearly the recent breakout of the 67275 resistance and then the retest
before a rally into a new high. From a risk management perspective, the buyers would
have a better risk to reward setup around the trendline
and the 67275 level to position for a new all-time high. The sellers, on the
other hand, will want to see the price falling below the support and the
trendline to turn the bias more bearish and pile in for a drop into the 64000
level.
Bitcoin Technical
Analysis – 1 hour Timeframe
Bitcoin 1 hour
On the 1 hour chart, we can
see that the price is now near the upper bound of the average daily range for today, so it might be a bad
idea to pile in around these levels for the buyers as there’s a risk of a
pullback.
Upcoming
Catalysts
Tomorrow we have the US Job Openings and the US Consumer Confidence reports. On
Wednesday, we have the US Employment Cost Index and the FOMC Policy Decision.
On Thursday, we get the latest US Jobless Claims figures and the US ISM
Manufacturing PMI. Finally, on Friday, we conclude the week with the US NFP
report.