Data shows the Bitcoin investors on derivatives exchanges still lean bearish toward the cryptocurrency even after the recent price recovery.
Bitcoin Short Positions Still Outweigh The Long Ones
In a new post on X, on-chain analytics firm Glassnode has talked about how Bitcoin market sentiment is looking from the lens of the derivatives market right now. The indicator shared by Glassnode is the “Long/Short Bias,” which measures the net amount of positions that large traders have currently opened.
When the value of this indicator is positive, it means the long positions outnumber the short ones. Such a trend implies the majority of the traders hold a bullish sentiment. On the other hand, the metric being under the zero mark implies more BTC positions are betting on a bearish outcome for the cryptocurrency.
Now, here is the chart shared by the analytics firm that shows the trend in the Bitcoin Long/Short Bias over the past month:
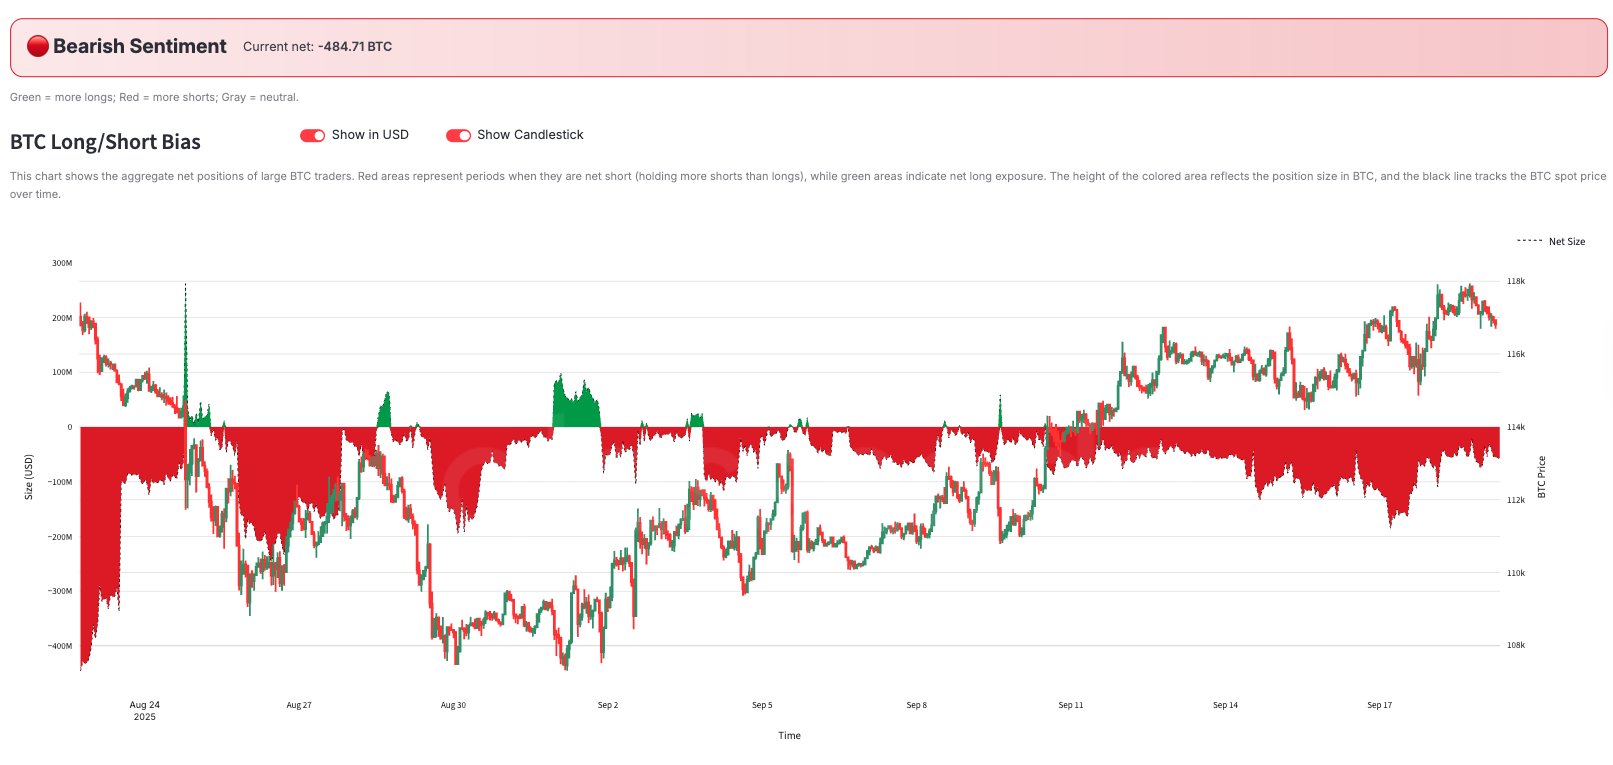
As displayed in the above graph, the Bitcoin Long/Short Bias has been negative for a while now, suggesting short positions have been the more dominant side of the market.
Interestingly, this hasn’t changed despite the price recovery that BTC has seen since the start of this month. At present, short positions still outweigh bullish bets by 485 BTC (worth around $56.2 million).
Historically, Bitcoin and other cryptocurrencies have tended to move in the direction that goes contrary to the crowd’s expectation, so the dominance of bearish sentiment in the derivatives market may not be such a bad thing.
In another X thread, Glassnode has discussed about some metrics related to the Bitcoin Options market. First of these is the Implied Volatility (IV), which measures the future volatility expectation of the Options traders.
In particular, the version of the metric that’s of interest here is the “At-The-Money” (ATM) one, which only shows this expectation for the traders with a strike price close to the current BTC spot value.
Below is a chart that shows the trend in this indicator across the major tenors for Bitcoin over the last few weeks.

From the graph, it’s apparent that the 1-week Bitcoin ATM IV rose ahead of the Federal Open Market Committee (FOMC) meeting, but then plunged after the Fed announced its decision. Longer expiry timeframes displayed no particular reaction to the event.
Another gauge for Options market volatility expectations is the IV Index (DVOL), which aggregates the IV across strike prices and tenors.
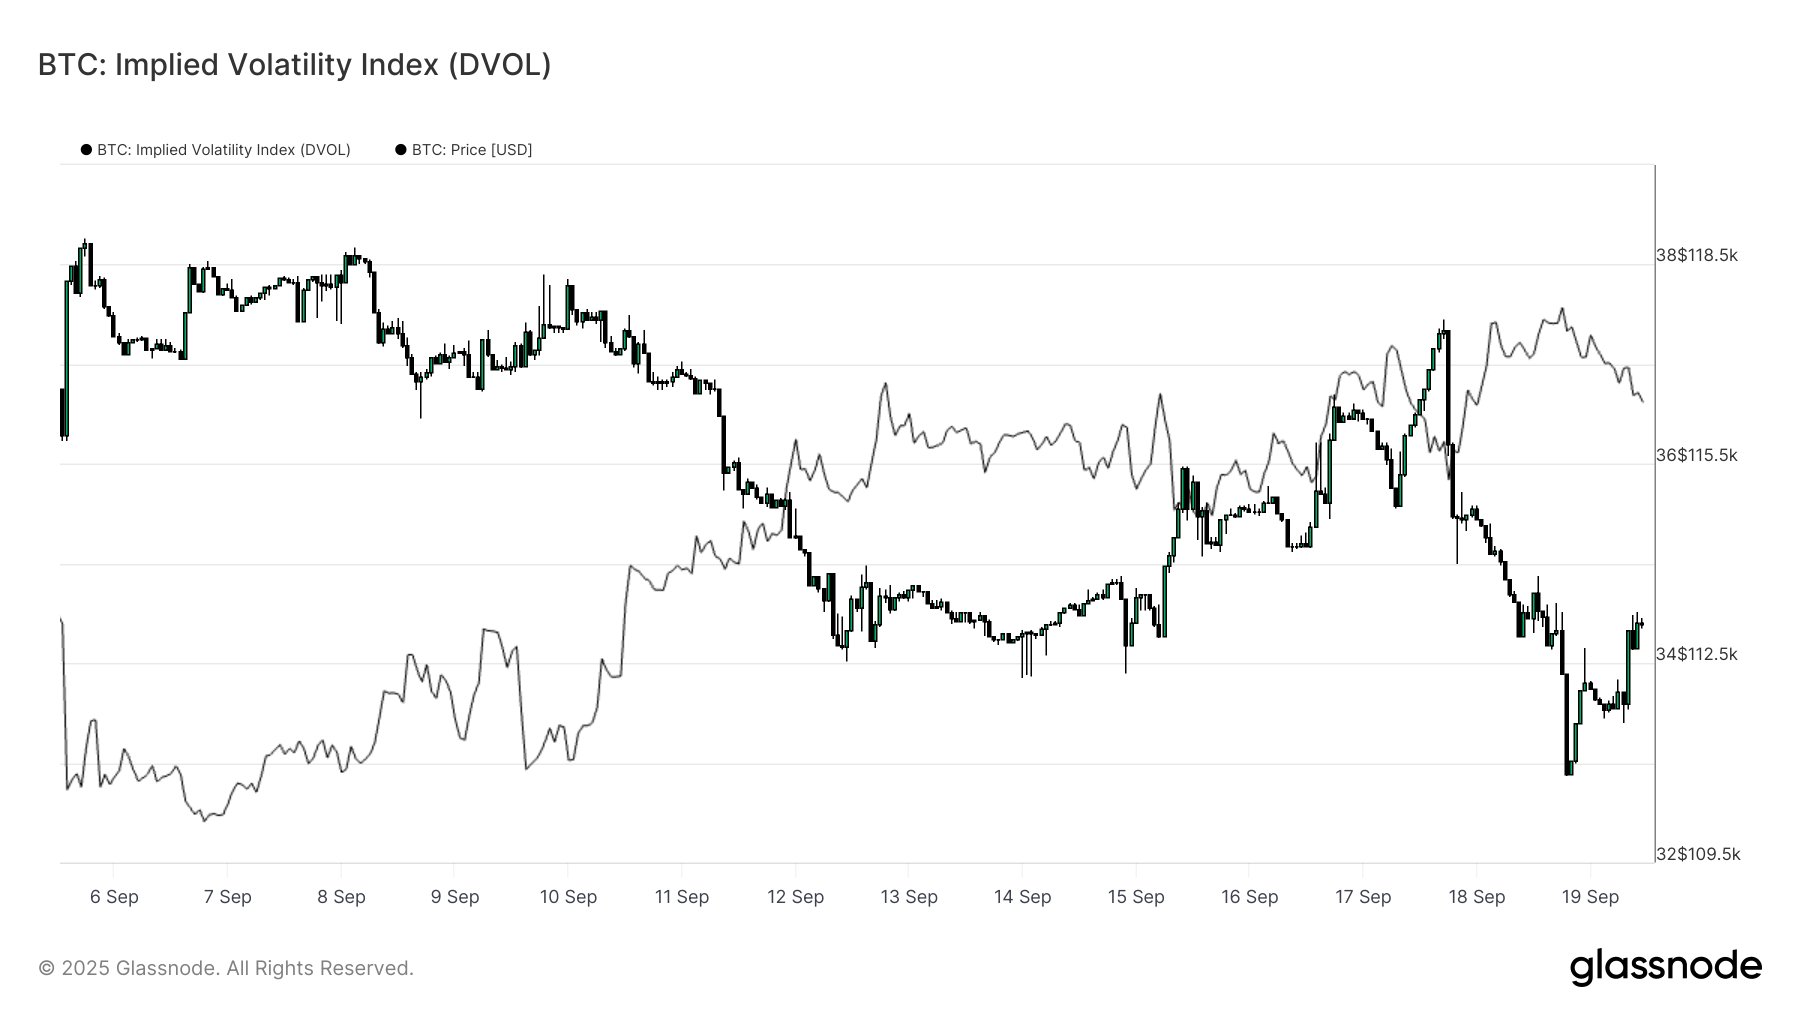
“Post-FOMC, DVOL dropped back, confirming the market is not pricing any sharp move in the near term,” notes Glassnode.
BTC Price
Bitcoin made recovery toward $117,900 earlier, but it seems the coin has faced a retrace as its price has dropped back to $116,000.