
Key Notes
- Spot Bitcoin ETFs just recorded their worst month since February, with $3.48B in outflows.
- Massive whale accumulation formed one of the densest cost-basis support zones near $80K.
- Analysts say Bitcoin’s dip under the DCA stress line historically signals the best long-term buy zones.
Bitcoin
BTC
$85 803
24h volatility:
6.5%
Market cap:
$1.71 T
Vol. 24h:
$71.53 B
entered December after ending the previous month with the worst performance for spot BTC ETFs since February, as heavy outflows met a sudden collapse in market liquidity.
SoSoValue data shows that spot ETF products ended November with $3.48 billion in net outflows, along with a brutal single‑day exit of $903 million on Nov. 20.
BlackRock’s IBIT saw its own record‑setting moment two days earlier when investors pulled $523 million and pushed its monthly outflows above $2.4 billion by Nov. 25. However, IBIT remains BlackRock’s most profitable ETF globally and holds more than $119 billion in assets, with cumulative inflows still sitting near $58 billion.
A Major Defense Against Bears
Glassnode observed in an X post that a fresh cost‑basis cluster showed up after BTC dropped to the $80,000 range and created one of the densest accumulation zones on the current heatmap.
A new cost-basis cluster formed after Bitcoin’s drop into the low-$80K region, showing fresh accumulation at these levels. This zone is now one of the densest on the heatmap and could act as a strong support area, likely to be defended by recent buyers.
📉https://t.co/M4LXVTyLB9 pic.twitter.com/yQHK8ziwMA— glassnode (@glassnode) December 1, 2025
The firm pointed out massive demand at the exact moment many short‑term traders sold, which turned the sell‑off into an opportunity. This cluster is now a potential defensive wall for the Bitcoin price action.
Market analyst Michael van de Poppe added that the start of a new month activated algorithms and drained liquidity, especially after multiple market makers were wiped out in October.
Typical move on the markets for $BTC.
Just on the clock, a new month starts, algorithms are activated, and the price is lower.
Liquidity is significantly low. Why? Because a ton of market makers got hammered on 10/10.
Nothing changed in the price action of #Bitcoin.
It was… pic.twitter.com/mNCcdZMl4r
— Michaël van de Poppe (@CryptoMichNL) December 1, 2025
Poppe added that BTC was rejected at a very important resistance and is still consolidating. He expects another test of that resistance within one or two weeks, followed by a real chance of a breakout toward $100,000.
Bitcoin was Executed?
On the other hand, entrepreneur Shanaka Anslem Perera argued that Bitcoin did not simply fall. In his words, it was “executed.” He attributed the shock to the spike in Japan’s government bond yields, which surged to levels not seen since before the global financial crisis.
That sudden rise dismantled the multi‑trillion‑dollar yen carry trade that allowed decades of cheap capital to flow into global assets. As yields climbed and the yen strengthened, leveraged positions turned unprofitable. Forced selling, margin calls and liquidations resulted in massive liquidations on October 10.
Perera also pointed out that whales accumulated roughly 375,000 BTC while institutions reduced exposure, and miners cut their own selling dramatically.
BITCOIN DID NOT CRASH.
It was executed.
The weapon: Japanese Government Bonds.
On December 1, 2025, Japan’s 10-year yield hit 1.877 percent. The highest since June 2008. The 2-year touched 1 percent. A level not seen since before Lehman fell.
This triggered the unwinding of… pic.twitter.com/i9aWPhoIbm
— Shanaka Anslem Perera ⚡ (@shanaka86) December 1, 2025
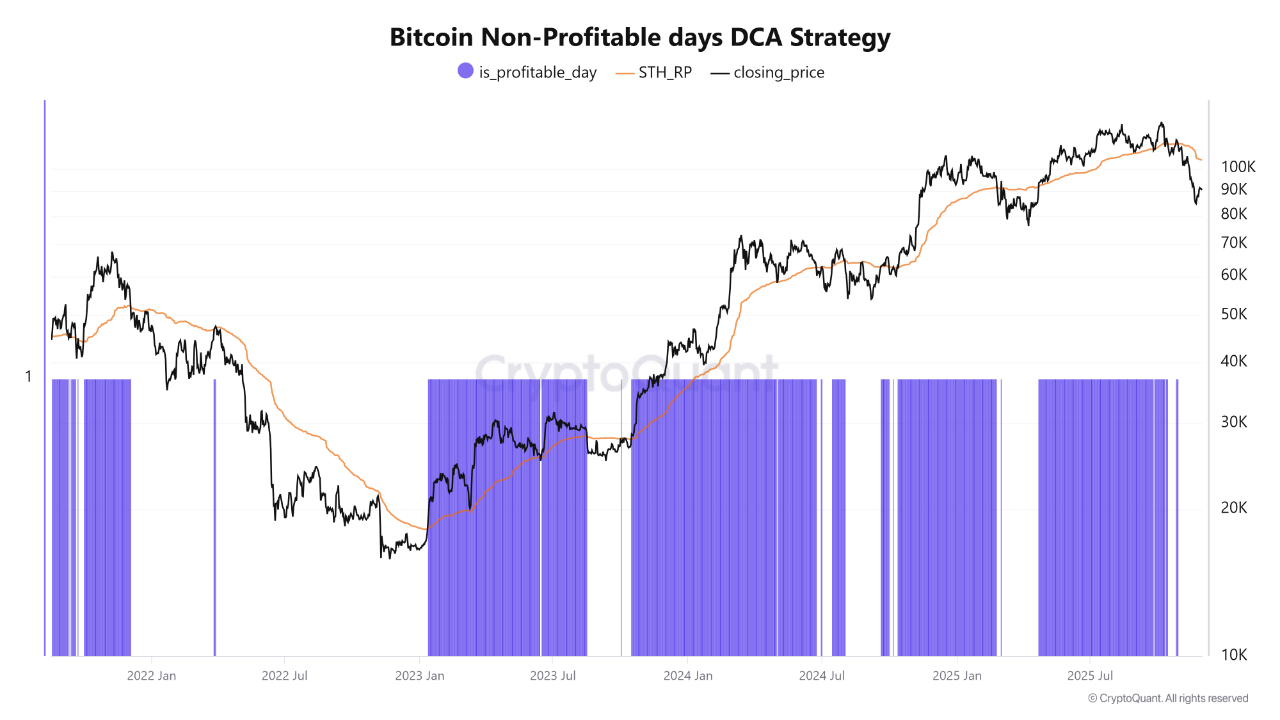
DCA All the Way
According to CryptoQuant analysts, whenever Bitcoin trades under the Non‑Profitable Days DCA Strategy line, new buyers sit at losses and the market enters a phase of stress and low volatility. Historically, such phases produced the strongest long‑term results for patient buyers.
Spot Bitcoin (BTC) ETFs have just recorded their worst month since February, with $3.48B in outflows
The method avoids attempts at prediction and relies on structural discount periods shown by cost‑basis behavior. The logic is simple: fear signals opportunity, not danger.
Disclaimer: Coinspeaker is committed to providing unbiased and transparent reporting. This article aims to deliver accurate and timely information but should not be taken as financial or investment advice. Since market conditions can change rapidly, we encourage you to verify information on your own and consult with a professional before making any decisions based on this content.

A crypto journalist with over 5 years of experience in the industry, Parth has worked with major media outlets in the crypto and finance world, gathering experience and expertise in the space after surviving bear and bull markets over the years. Parth is also an author of 4 self-published books.