piranka
Performance Summary**
|
1 year |
Since Inception Annualized |
Q2 2024 |
||
|
Total return (NAV) |
-2.9% |
-17.1% |
-6.2% |
|
|
Total return (market price) |
0.6% |
-20.0% |
-9.0% |
|
|
MSCI USA SMID Growth Call Overwrite Index |
9.3% |
5.9% |
-3.9% |
|
|
Russell 2500 Growth Index |
9.0% |
-1.8% |
-4.2% |
|
MSCI USA SMID Growth Call Overwrite Index: An index that incorporates an option overlay component on the MSCI USA SMID Growth Index with a 25% overwrite level. Russell 2500 Growth Index measures the performance of the small to mid-cap growth segment of the US equity universe. ** Source: Morningstar & BlackRock as of 6/30/2024. The Trust’s inception date was 3/29/21. Returns are shown net of advisory fees paid by the Trust and net of the Trust’s operating fees and expenses. As of the Trust’s annual report dated 12/31/2023, the Trust’s gross expense ratio is 1.44%. Investors who purchase shares of the Trust through an investment adviser or other financial professional may separately pay a fee to that service provider. Past performance is not indicative of future results. The performance quoted represents past performance and does not guarantee future results. Investment return and principal value of an investment will fluctuate so that an investor’s shares may be worth more or less than the original cost. Current performance may be lower or higher than the performance quoted, and numbers may reflect small variances due to rounding. Refer to BlackRock.com for current month end performance. |
Performance
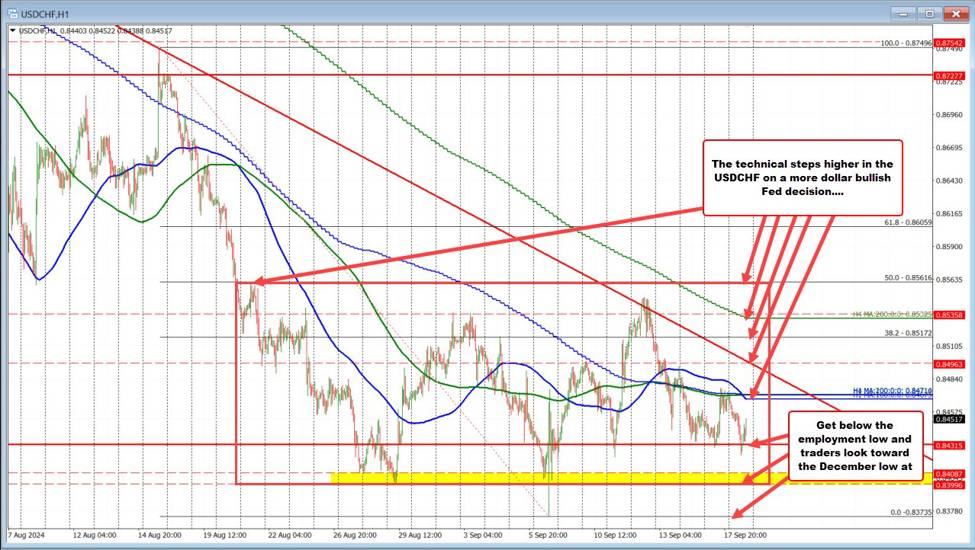
During the second quarter, shares of NYSE:BIGZ underperformed the Russell 2500 Growth Index on a market price basis, returning– 9.0% vs– 4.2% for the index. On an NAV basis, BIGZ returned– 6.2%, underperforming the Russell 2500 Growth Index.
Contributors to Performance **
- The largest contributor to performance during the quarter was stock selection in the communication services sector, particularly within the interactive media and services industry. In this space, Pinterest Inc. (PINS) appreciated over during the period.
- Elsewhere in Communication services, returns were bolstered by stock selection in both the wireless telecom and media industries, as private holding Loft Orbital Solutions Inc. was revalued upward and public holding Liberty Media Corp. appreciated more during the period*
- In Financials, the Trust achieved outperformance across several industries by carrying underweights in poor performing areas and through strong stock selection in the lone overweight, the capital markets industry.
- In the information technology space, excellent results in the semi-conductor space were offset by some weakness in the IT services area. Within semis, Trust holdings Monolithic Power Systems, Inc. (MPWR) and ASM International NV (OTCQX:ASMIY) both had strong returns during the quarter, fueled by continued excitement around artificial intelligence. Private holdings PSI Quantum Corp. was also revalued upward, further enhancing returns for the Trust.
|
** References to specific securities and their issuers are for illustrative purposes only and are not intended and should not be interpreted as recommendations to purchase or sell such securities. BlackRock may or may not own the securities referenced and, if such securities are owned, no representation is being made that such securities will continue to be held. The holdings mentioned in the commentary represent the largest contributors and detractors to performance relative to the benchmark. They are not representative of all underlying investments made by the manager on behalf of the strategy, and it should not be assumed that the manager will invest in these investments or in comparable investments, or that any future investments made by the manager will be successful. To the extent that these investments prove to be profitable, it should not be assumed that the strategy will be profitable or will be as profitable. **Source: BlackRock 6/30/2024 |
Detractors from Performance*
- The largest detractor from returns during the quarter was stock selection in the healthcare sector, which was most notable across the healthcare equipment and supplies space. Here, Align Technology Inc. (ALGN), a marker of clear plastic teeth aligners, declined after posting negative quarterly results and highlighting softening orthodontic case starts in the industry.
- Healthcare positions in the life sciences tools & services industry also declined. Holdings in Repligen Corp. (RGEN), West Pharmaceutical Services Inc. (WST) and Charles River Laboratories International Inc. (CRL) all posted negative returns during the quarter.
- Results in the real estate sector also weighed on performance during the quarter, mostly within the real estate management and development space. Here, portfolio company CoStar Group Inc. (CSGP) declined– 23.3% after missing expectations on earnings and reporting pressure on profit margins.
- Stock selection in the industrials sector also detracted from performance during the period. This was most notable in the ground transportation industry where trucking company Saia Inc. (SAIA) reported softer than expected earnings, some weather-related operational disruptions and weaker than anticipated seasonal shipments during the prior quarter.
- Our energy and utilities companies also detracted during the second quarter.
| *References to specific securities and their issuers are for illustrative purposes only and are not intended and should not be interpreted as recommendations to purchase or sell such securities. BlackRock may or may not own the securities referenced and, if such securities are owned, no representation is being made that such securities will continue to be held. The holdings mentioned in the commentary represent the largest contributors and detractors to performance relative to the benchmark. They are not representative of all underlying investments made by the manager on behalf of the strategy, and it should not be assumed that the manager will invest in these investments or in comparable investments, or that any future investments made by the manager will be successful. To the extent that these investments prove to be profitable, it should not be assumed that the strategy will be profitable or will be as profitable. |
Portfolio Positioning
- As of period-end, the portfolio’s largest overweight allocations relative to the Russell 2500 Growth Index were the information technology, communication services and consumer discretionary sectors. The largest underweight allocations were in the healthcare, consumer staples and financials sectors.
- As a result of portfolio trading and market movements during the first half of the year, the portfolio experienced increasing allocations to the industrials, communication services and consumer discretionary sectors, and decreasing allocations to both the information technology and healthcare sectors.
Investment Outlook
Large-cap growth equities posting strong gains in each of the first two quarters to start the year. In contrast, Mid-cap growth and small-cap growth equities have achieved more modest year-to-date gains respectively. In addition, first quarter appreciation in the small and mid-cap areas being partially offset by second quarter price declines.
In our view, the market rally has continued to be propelled by two primary factors: [1] relatively strong corporate earnings, especially among a small group of mega-cap stocks and [2] continued investor expectations for a“Goldilocks” outcome of positive economic growth, easing inflation and flexibility for future Fed interest rate cuts. Despite recent signs of economic growth moderating and the U.S. job market decelerating, we view these developments as a normalization of the economic backdrop, and not indicative of rising recession risks. In alignment with our investment philosophy, our portfolios continue to seek exposure to businesses with attractive and growing end markets.
A swell in datacenter capital expenditures is one of the important points we think about in our research pipeline, while we continue to investigate investment opportunities across a host of other sectors, industries, and business models. The goal of our research process is to identify actionable investment ideas to help understand a company’s potential earnings growth, then compare those prospects to consensus expectations. This discipline aligns our investment decision-making alongside the time horizon of company management teams and helps to anchor our investment convictions during bouts of volatility.
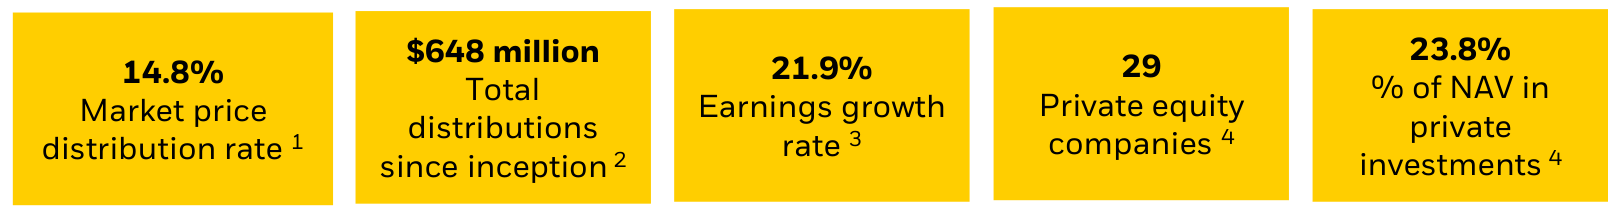
BIGZ Portfolio Statistic Highlights
|
1See page 7 for further information. Distribution rate is calculated by annualizing the Trust’s latest declared regular distribution on 6/30/2024 and dividing that number by the Trust’s market price as of 6/30/2024. The distribution rate is calculated net of expenses. BIGZ’s estimated source of distributions paid during the current fiscal year to date is 100% return of capital as of 6/30/2024. The amounts and sources of distributions reported are only estimates and are not provided for tax reporting purposes. Past performance does not guarantee or indicate future results. 2As of 6/30/2024. Source BlackRock. Total BIGZ estimated source of distributions paid since inception are 100% return of capital as of 6/30/2024. See page 7 for further information. Past performance does not guarantee or indicate future results. 3As of 6/30/2024. Source BlackRock. BIGZ seeks to invest in growth companies and earnings growth is a measure that is commonly used to measure growth. “Earnings growth rate” represents the 5-year historical change in profit expressed in annualized terms for the public companies in the portfolio. Past performance does not guarantee or indicate future results. 4As of 6/30/2024. See page 3 for further details |
Option activity*
|
BIGZ Options |
|
|
% of portfolio overwritten |
11.8% |
|
% out of the money |
6.0% |
|
Days average maturity |
54 Days |
| * Definitions: “% of portfolio overwritten:” Represents the amount of the portfolio represented by the notional value of covered call options. These options generate cash flow via a premium received, potentially offsetting the impact of a specific stock price drop. “% out of the money:” Represents the amount in which the option’s strike price is higher than the current market price. If a covered stock’s price rises above the strike price, it will limit the profitability of that holding to the amount of that strike price. “Average maturity:” The average length of the option contracts in the Trust. Source: BlackRock as of 6/30/2024. |
- The Trust utilizes an option writing (selling) strategy in seeking to manage risk, generate current gains from options premiums, and enhance risk-adjusted returns.
- The team maintained the call option writing strategy during the period. The option strategy employs a dynamic call writing process focused on single stocks to allow for the combination of cash flow and capital appreciation.
- This includes using multiple option positions diversified across strike prices and expiration dates while taking into account changes in market conditions affecting option pricing.
- Given the extreme weakness in the small and mid-cap innovation market, the percentage of the portfolio overwritten remained low at the end of the quarter, which we believe positions the strategy for greater potential upside in coming quarters
- These call options were typically written at prices above the prevailing market prices.
Editor’s Note: The summary bullets for this article were chosen by Seeking Alpha editors.
This post originally appeared on BlackRock.
Editor’s Note: This article discusses one or more securities that do not trade on a major U.S. exchange. Please be aware of the risks associated with these stocks.