Adam Gault
In this article, we catch up on the Q1 results of Carlyle Secured Lending (NASDAQ:CGBD). CGBD trades at a dividend yield of 10.7% and a 3% premium to NAV. Its net investment income price yield is 12.7% – more than 1% above the sector median level.
CGBD has a fairly typical BDC portfolio profile, with an 80%+ first lien allocation (when taking into account its investment funds). Its median company EBITDA of $81m is also in the sweet spot of the middle-market segment. Its sector exposure is tilted to Business Services and Healthcare – fairly common in the BDC space.
CGBD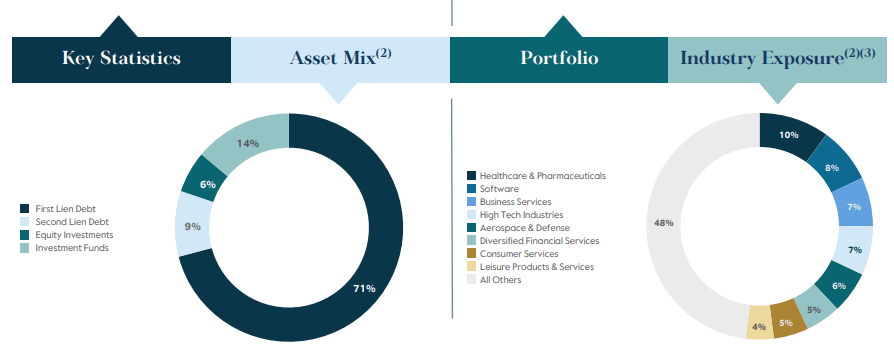
Quarter Update
Adjusted net income came in at $0.54 – a slight drop from the Q4 level.
Systematic Income BDC Tool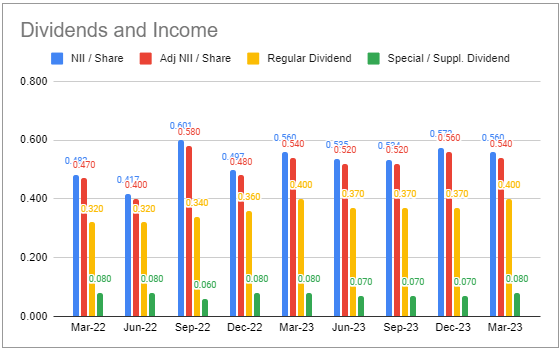
In our last update we highlighted the bump in the “Other” bucket in the December quarter and suggested this could reverse in the March quarter, leading to a drop in net income, and this is indeed what has happened. Management said that a decrease in prepayment and amendment fees was partly offset by an increase in original issue discount acceleration, largely from one exit.
Systematic Income BDC Tool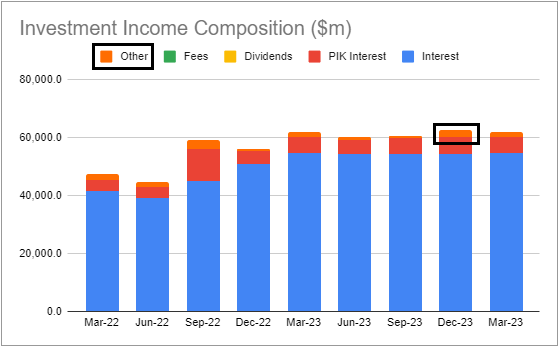
The company declared a $0.47 total dividend, consisting of the same $0.40 base dividend as in the previous quarter and a $0.07 supplemental – a drop of a penny from the previous quarter. This leaves total dividend coverage at 115%.
The company’s dividend profile has lagged the sector somewhat, in large part due to the company’s larger reliance on floating-rate liabilities, which has squeezed net income as short-term rates marched higher over the last couple of years. At the same time, this should result in a smaller net income drop if short-term rates fall over the medium term.
Systematic Income BDC Tool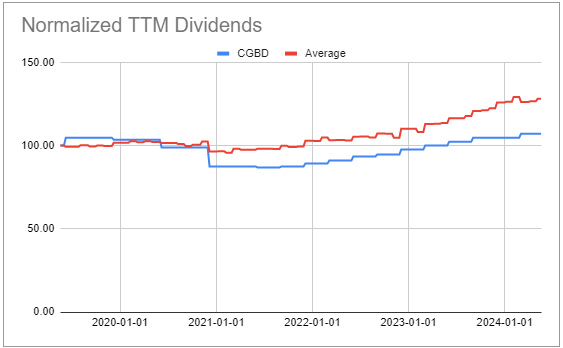
Recall that CGBD also introduced a new supplemental dividend framework – in line with what several other BDCs have done, such as OBDC and GBDC. Specifically, the company will pay out at least half of the excess net income (i.e. adjusted net income less base dividend) through the supplemental dividend.
The NAV rose by close to 0.5%, primarily due to retained income.
CGBD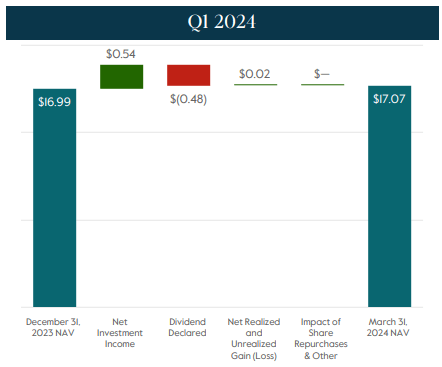
This is the third quarterly rise in a row, with the NAV not far off its 5-year peak.
Systematic Income BDC Tool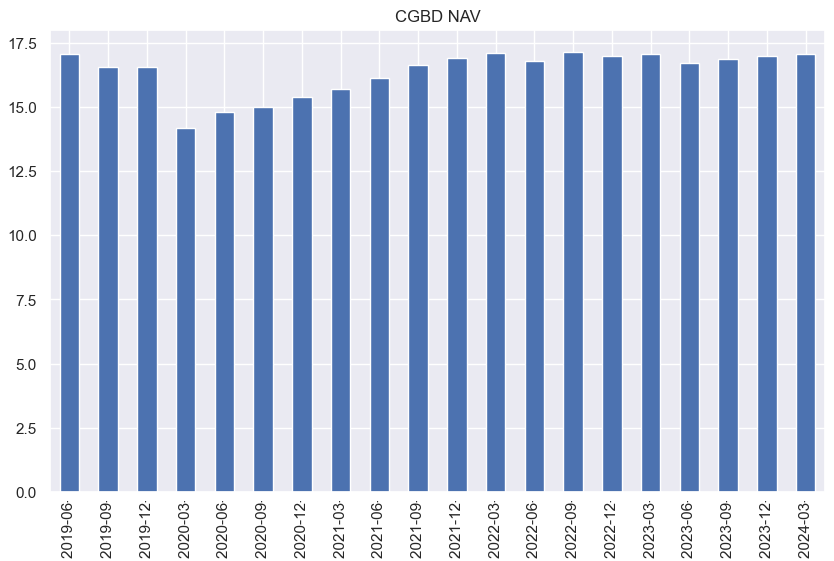
Income Dynamics
Net new investments were low, as sales / repayments exceeded new fundings.
Systematic Income BDC Tool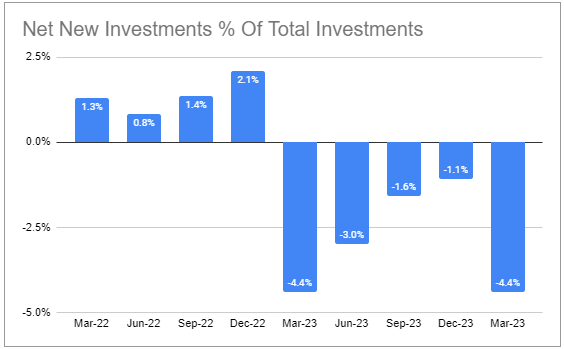
This pushed leverage lower – net leverage is very low at 0.95x.
Systematic Income BDC Tool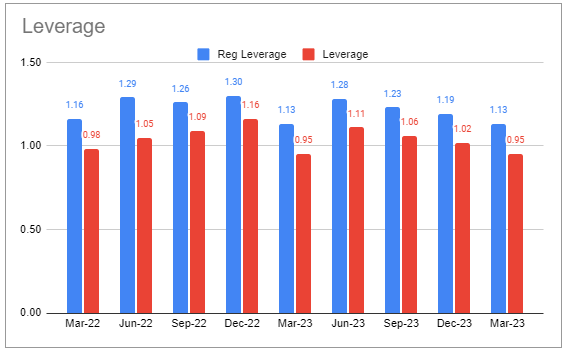
Asset yield has fallen slightly, as has interest expense.
Systematic Income BDC Tool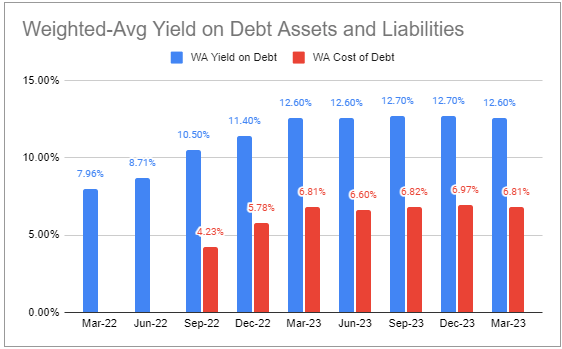
Portfolio asset yield moved lower for two reasons in our view – a focus on first-lien investments in the face of significant second-lien prepayments. And two, a drop in credit spreads in the broader credit market.
CGBD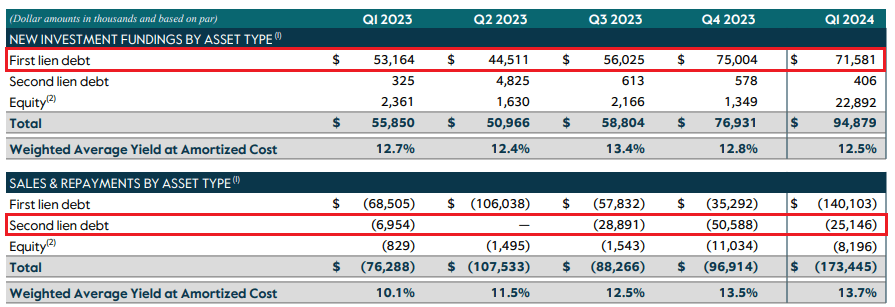
Lower interest expense was due to the drop in floating-rate credit facility utilization – a result of a drop in leverage. Overall, the company’s net interest margin on its leverage assets is below the sector average, largely due to its above-average interest expense.
The company swapped the bond it issued last year (CGBDL) to a floating-rate. This may have looked attractive at the end of the year when the market expected 6-7 Fed rate cuts, but now is not at all obvious as the market now expects 1-2 cuts this year. Ironically, management said that their economist viewed a higher-for-longer Fed as the most likely scenario, which would have been good advice to heed rather than swap the bond out.
Portfolio Quality
Non-accruals fell to 0.2% as a result of a recapitalization of a position that was previously on non-accrual.
Systematic Income BDC Tool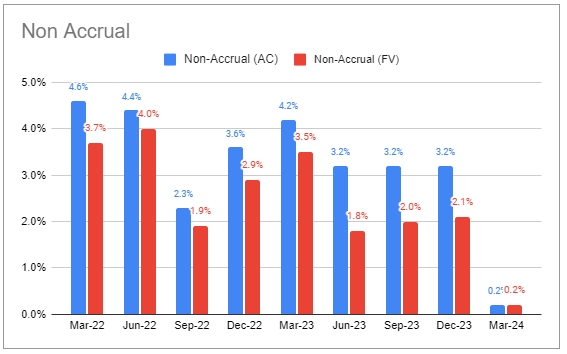
This was likely not painless, as the company crystallized a net realized loss.
Systematic Income BDC Tool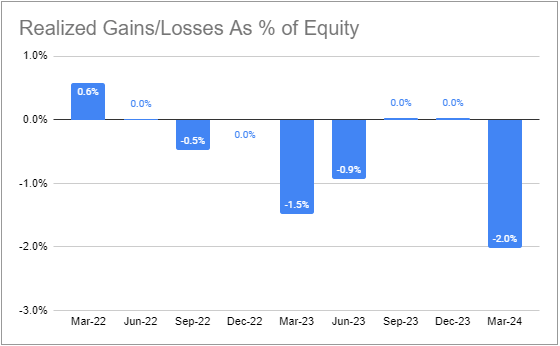
Overall, the company has been running a fairly clean portfolio, with no new non-accruals and no additions to the watch list (deals with risk ratings 4 or 5) in the last two quarters.
The weighted-average portfolio risk rating improved slightly.
Systematic Income BDC Tool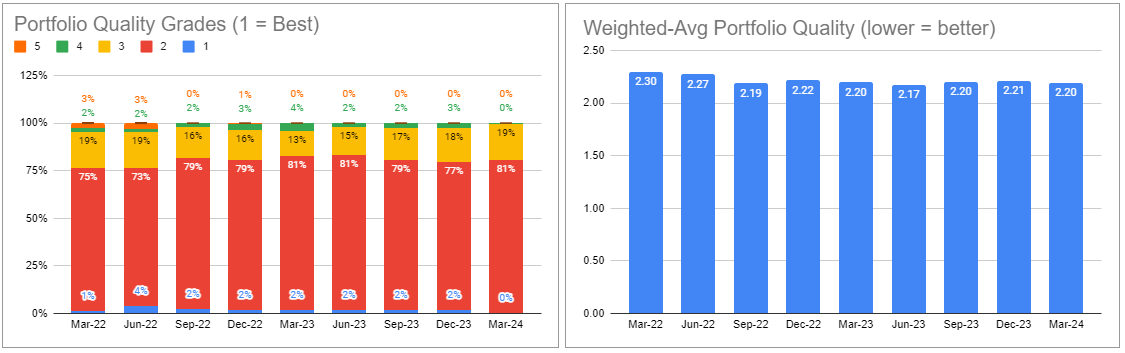
The company’s portfolio has been reducing its allocation to second-lien loans. The first-lien allocation is now at a multi-year-high.
Systematic Income BDC Tool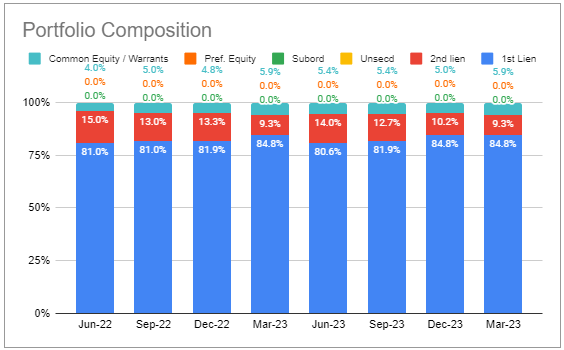
Valuation And Return Profile
CGBD has delivered average or above-average performance since around 2020.
Systematic Income BDC Tool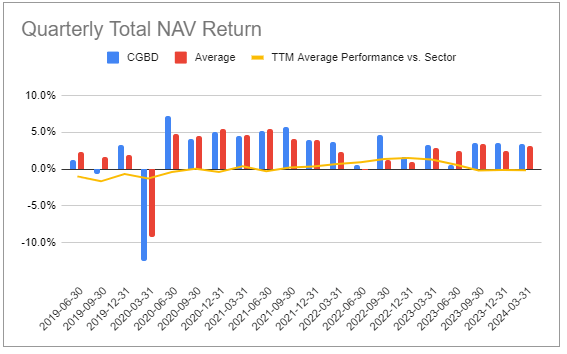
This has translated into solid total NAV returns over various periods.
Systematic Income BDC Tool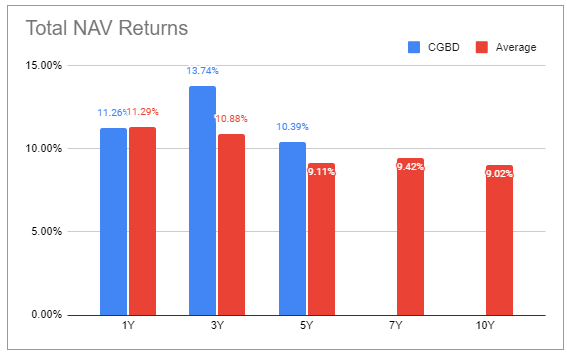
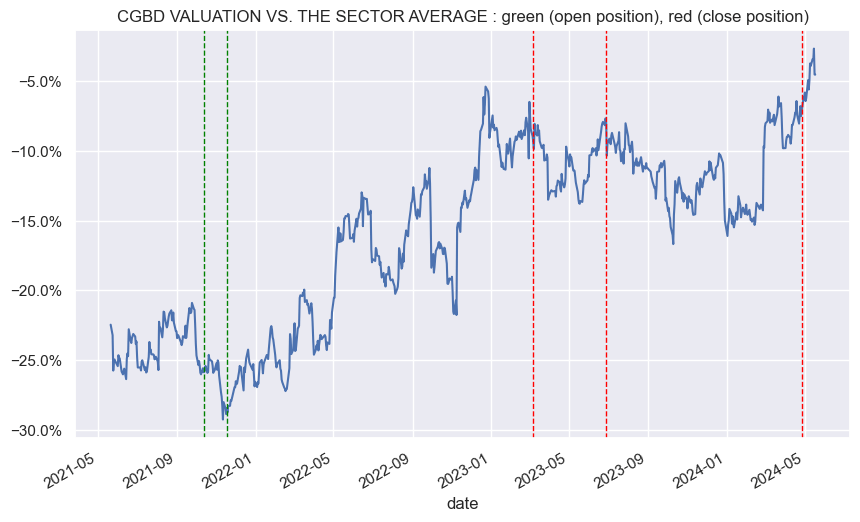
It has tended to trade at fairly depressed valuations historically but has recently broken through 100% and the valuation is now trading at a premium and well above the historic average level.
Systematic Income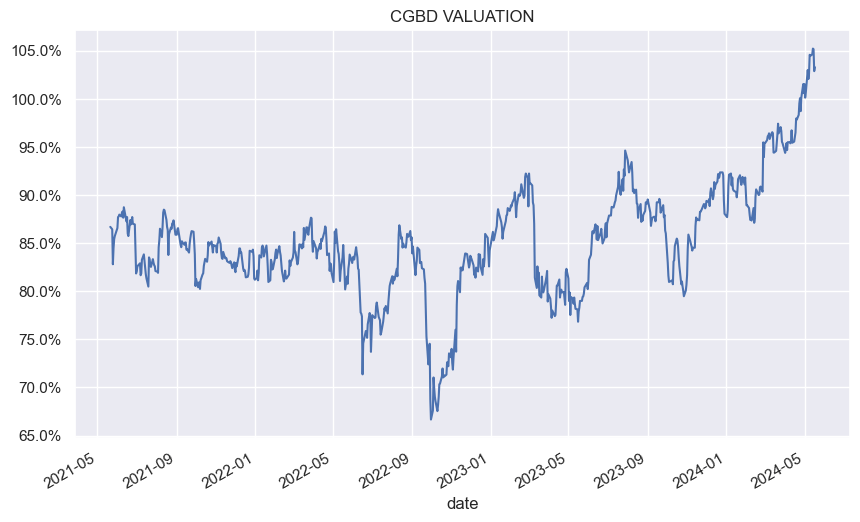
The valuation gap with the broader sector is now less than 5%. The valuation gap to the median BDC in our coverage is only 2% (103% CGBD valuation vs. 105% median BDC valuation). This is a long way from a valuation gap of 15-30% that the stock used to trade at only recently.
Systematic Income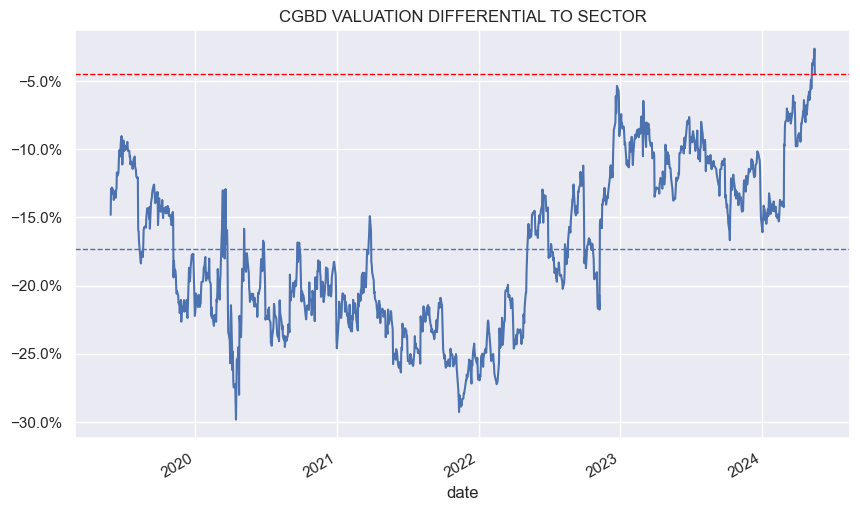
We originally added the stock in 2021 when it was trading at a valuation 25-30% cheaper than the sector average despite decent performance, and rode that to a single-digit valuation gap. We still hold a modest position in the name but have mostly exited it. We would consider adding on a double-digit valuation discount to the sector.
Systematic Income