
Henrik Sorensen/DigitalVision via Getty Images
By Daniel Chu, CFA | Charles Hamieh | Shane Hurst | Nick Langley
Structural Tailwinds Make Utilities High Income and High Growth – Market Overview
Infrastructure and global equities rose in the second quarter, with infrastructure trailing global equities modestly as strength in defensive sectors faded late in the quarter, despite a moderation in bond yields. Overall, as investors began to appreciate the growing power demand from data centers supporting AI, this was positive for electric utilities. Energy infrastructure also benefited from an improving natural gas price outlook and growing acknowledgment that midstream infrastructure plays a key role to back up renewable power as AI demand grows.
Airports were weaker, by contrast, amid lower summer traffic expectations for some European airports, while a mix of coal haulage, fuel headwinds and a loose truck market placing pressure on tariff increases for the rails weighed on that sector. While the pace of recovery in the U.S. freight market has been slower than our original expectations, we still expect an improvement in the operating environment in the back half of 2024 and early 2025, as excess trucking transportation capacity continues to rationalize in the softer pricing environment. We expect transportation supply and freight demand rebalancing to bode well for U.S. rails.
By region, the U.S. and Canada performed well, with returns centered around the abovementioned drivers for electric utilities and energy infrastructure, while concerns over possible government intervention in Brazil weighed on performance in Latin America. Japan’s rail traffic recovery plateaued and looked to settle on a new normal, meanwhile, dragging down Asia Pacific Developed.
In addition to airports weighing on Western Europe, U.K. water lagged largely due to political turmoil in the U.K., with a snap election and a water regulator ruling set for early July. Listed water companies there have also been unduly discounted due to trouble at an unlisted peer. Near-term political volatility could represent a buying opportunity for listed U.K. water utilities, however. Their spending on improving environmental impacts adds to the bottom line, and their investments can earn attractive allowed returns, which translates to better earnings and dividends. The listed water infrastructure companies we like are leaders in environmental responsibility, with strong track records and targets for environmental performance that we believe the regulator and investors will reward over time.
Within the U.S. and Canada, U.S. electric utilities NextEra Energy (NEE) and Southern Company (SO) were the lead performers. NextEra Energy is an integrated utility business with a regulated utility operating in Florida and is the largest wind business in the U.S. NextEra’s regulated business, including Florida Power & Light, serves nine million people in Florida. Shares benefited from a positive read-through to power and renewables demand as a result of data center growth from AI.
Southern Company serves 4.4 million electricity customers in the Southeastern U.S. Southern has over 42,000 MW of generating capacity in Georgia, Alabama, Mississippi and Florida, and has some of the best regulatory relationships in the nation. Southern businesses include electric utilities in four states and a growing competitive generation company, as well as fiber optics and wireless communications. Southern shares outperformed after the completion of 1,114 MW Unit 4 of its Vogtle Nuclear Plant, which entered commercial operation in March. Additionally, the company highlighted strong growth potential as Georgia stands to benefit significantly from the expansion of AI data centers.
U.K. electric utility National Grid (NGG) and U.S. communications company Crown Castle (CCI) were the largest detractors. National Grid is one of the world’s largest publicly owned utilities focused on transmission and distribution activities in electricity and gas. National Grid’s share price fell during the quarter due to a dilutive $7 billion rights issue. We have since reduced our position as the investment thesis has weakened. We currently have our senior analysts in Europe meeting with the company to gain further clarity on the company’s outlook.
Crown Castle is the leading independent owner and operator of wireless communications infrastructure in the U.S. with a portfolio of approximately 40,000 towers. Crown Castle underperformed following the conclusion of its operating strategic review. While the outcome was beneficial for cash flow, the perception is that divestment of the fiber business now seems less likely.
Outlook
Our view is that infrastructure fundamentals are very strong: not only are inflation pass-throughs operating as expected, but there are also several strong long-term themes not getting sufficient recognition by the market, thus creating attractive entry points.
Utilities are forecasting strong network growth driven by decarbonization in addition to replacement of aging infrastructure and resiliency spend. Geopolitical tensions and incentives put in place over the last three years, meanwhile, are leading to an increasing amount of near sourcing and onshoring in places like the U.S., which should further support spending for infrastructure. In addition, AI-related investment will be significant growth drivers for infrastructure investors, due to surging demand for electricity from AI-powering data centers.
Whilst the past 12-18 months have been challenging for infrastructure due to the sharp rise in bond yields and bond volatility, in addition to the narrow market breadth, we think the macro headwinds are starting to become tailwinds. Historically, we have seen infrastructure outperform global equities over several time periods as interest rates have peaked (Exhibit 1), something to keep in mind as inflation indicators slow and allow major central banks to move toward easing. We also believe bond yields need not roll over for investors to benefit from infrastructure returns, but that merely reduced volatility of bond yields could be supportive of valuations, something we have seen in the past.
Exhibit 1: Infrastructure Performance Following Last Fed Rate Hikes
As of March 31, 2024. Source: ClearBridge, FactSet, Bloomberg. The RARE 200 is the combination of the investment universes (updated on a quarterly basis) for ClearBridge Investments’ infrastructure strategies. Constituents as of March 31, 2024, measuring total return in local currency. Global equities: MSCI AC World Index, gross returns in local currency. Performance reflective of the six-month, one-year, three-year and five-year period following the last Fed rate hike prior to cutting cycles in 1989, 1995, 2001, 2007 and 2019.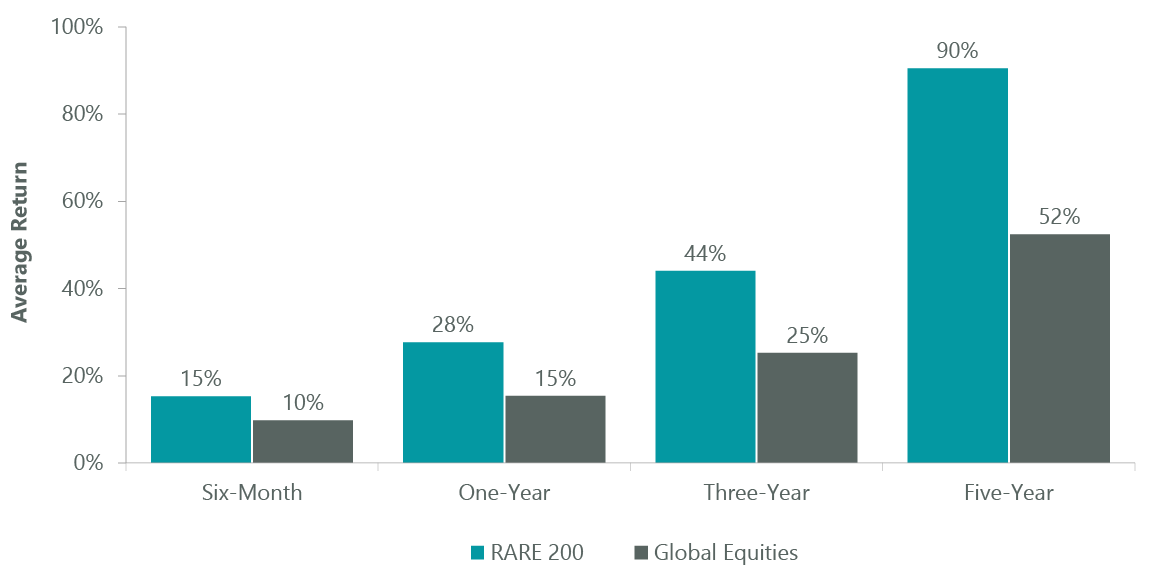
In terms of positioning, due to our income objective, our regulated and contracted utilities exposure is greater than our user-pays exposure. Nonetheless, due to the strong structural drivers of decarbonization, significant network investment, supply chain realignment and powering AI/data centers, we pivot toward high-growth regulated and contracted utilities with exposures to these themes.
As the market broadens, we expect it to recognize the strong long-term themes driving the asset base growth of our infrastructure companies and provide tailwinds for investors seeking income rivalling that of bonds and cash and the potential for meaningful capital upside.
Portfolio Highlights
We believe an absolute return, inflation-linked benchmark is the most appropriate primary measure against which to evaluate the long-term performance of our infrastructure strategies. The approach ensures the focus of portfolio construction remains on delivering consistent absolute real returns over the long term.
On an absolute basis, the Strategy saw positive contributions from three of the nine sectors in which it was invested in the second quarter, with the electric and energy infrastructure sectors the main positive contributors and rail, toll roads and communications the main detractors.
Relative to the S&P Global Infrastructure Index and on a U.S. dollar basis, the Strategy underperformed in the second quarter, driven primarily by stock selection in the renewables sector, although most of this was offset by an overweight allocation to that sector. Stock selection in the electric, rail, toll roads and water sectors also detracted, while an airport underweight contributed positively.
On an individual stock basis, the top contributors to absolute returns in the quarter were NextEra Energy, Southern Company, Pembina Pipeline (PBA), Public Service Enterprise (PEG) and Enel (OTCPK:ENLAY). The main detractors were National Grid, Crown Castle, Union Pacific (UNP), CCR and Pennon (OTCPK:PEGRF)(OTCPK:PEGRY).
In addition to portfolio activity discussed above, during the quarter we initiated a position in German airport operator Fraport (OTCPK:FPRUF)(OTCPK:FPRUY) and exited our position in Japanese rail operator West Japan Railway.
Daniel Chu, CFA, Director, Portfolio Manager
Charles Hamieh, Managing Director, Portfolio Manager
Shane Hurst, Managing Director, Portfolio Manager
Nick Langley, Managing Director, Portfolio Manager
|
Past performance is no guarantee of future results. Copyright © 2024 ClearBridge Investments. All opinions and data included in this commentary are as of the publication date and are subject to change. The opinions and views expressed herein are of the author and may differ from other portfolio managers or the firm as a whole, and are not intended to be a forecast of future events, a guarantee of future results or investment advice. This information should not be used as the sole basis to make any investment decision. The statistics have been obtained from sources believed to be reliable, but the accuracy and completeness of this information cannot be guaranteed. Neither ClearBridge Investments, LLC nor its information providers are responsible for any damages or losses arising from any use of this information. All returns are in local currency unless otherwise indicated. Performance source: Internal. Benchmark source: Morgan Stanley Capital International. Neither ClearBridge Investments, LLC nor its information providers are responsible for any damages or losses arising from any use of this information. Performance is preliminary and subject to change. Neither MSCI nor any other party involved in or related to compiling, computing or creating the MSCI data makes any express or implied warranties or representations with respect to such data (or the results to be obtained by the use thereof), and all such parties hereby expressly disclaim all warranties of originality, accuracy, completeness, merchantability or fitness for a particular purpose with respect to any of such data. Without limiting any of the foregoing, in no event shall MSCI, any of its affiliates or any third party involved in or related to compiling, computing or creating the data have any liability for any direct, indirect, special, punitive, consequential or any other damages (including lost profits) even if notified of the possibility of such damages. No further distribution or dissemination of the MSCI data is permitted without MSCI’s express written consent. Further distribution is prohibited. Performance source: Internal. Benchmark source: Standard & Poor’s. |